Best Tradingview Indicators For Day Trading

Day trading, the practice of buying and selling financial instruments within the same trading day, requires precise timing and quick decision-making. For traders navigating the volatile markets, TradingView, a popular charting platform, offers a plethora of technical indicators. Choosing the right tools can be crucial for success, but the sheer volume of options can be overwhelming.
This article explores some of the most widely used and respected TradingView indicators for day trading, highlighting their functionalities and how they can be incorporated into a trading strategy. It aims to provide a balanced overview, acknowledging both the potential benefits and inherent limitations of relying solely on technical analysis.
Understanding the Role of Technical Indicators
Technical indicators are mathematical calculations based on historical price and volume data. They are designed to forecast future price movements, identify potential entry and exit points, and confirm trends. However, it is crucial to remember that indicators are not foolproof and should be used in conjunction with other forms of analysis, such as fundamental analysis and risk management strategies.
Moving Averages: Smoothing Out the Noise
Moving Averages (MAs) are among the most fundamental and widely used indicators. They smooth out price data by calculating the average price over a specific period. This helps traders to identify the overall trend direction and potential support and resistance levels. Common types include Simple Moving Averages (SMA) and Exponential Moving Averages (EMA), with the EMA giving more weight to recent prices.
A 2023 report by Investopedia highlighted the importance of using moving averages in conjunction with other indicators. A 20-day EMA, for instance, is often used to identify short-term trends, while a 200-day SMA can signal longer-term shifts in the market.
Relative Strength Index (RSI): Measuring Momentum
The Relative Strength Index (RSI) is a momentum oscillator that measures the magnitude of recent price changes to evaluate overbought or oversold conditions in the price of a stock or other asset. It ranges from 0 to 100, with readings above 70 typically indicating an overbought condition and readings below 30 suggesting an oversold condition. Traders often use the RSI to identify potential reversal points.
According to TradingView's official documentation, the RSI is best used in conjunction with price action analysis. Divergences between the RSI and price can signal a potential trend reversal.
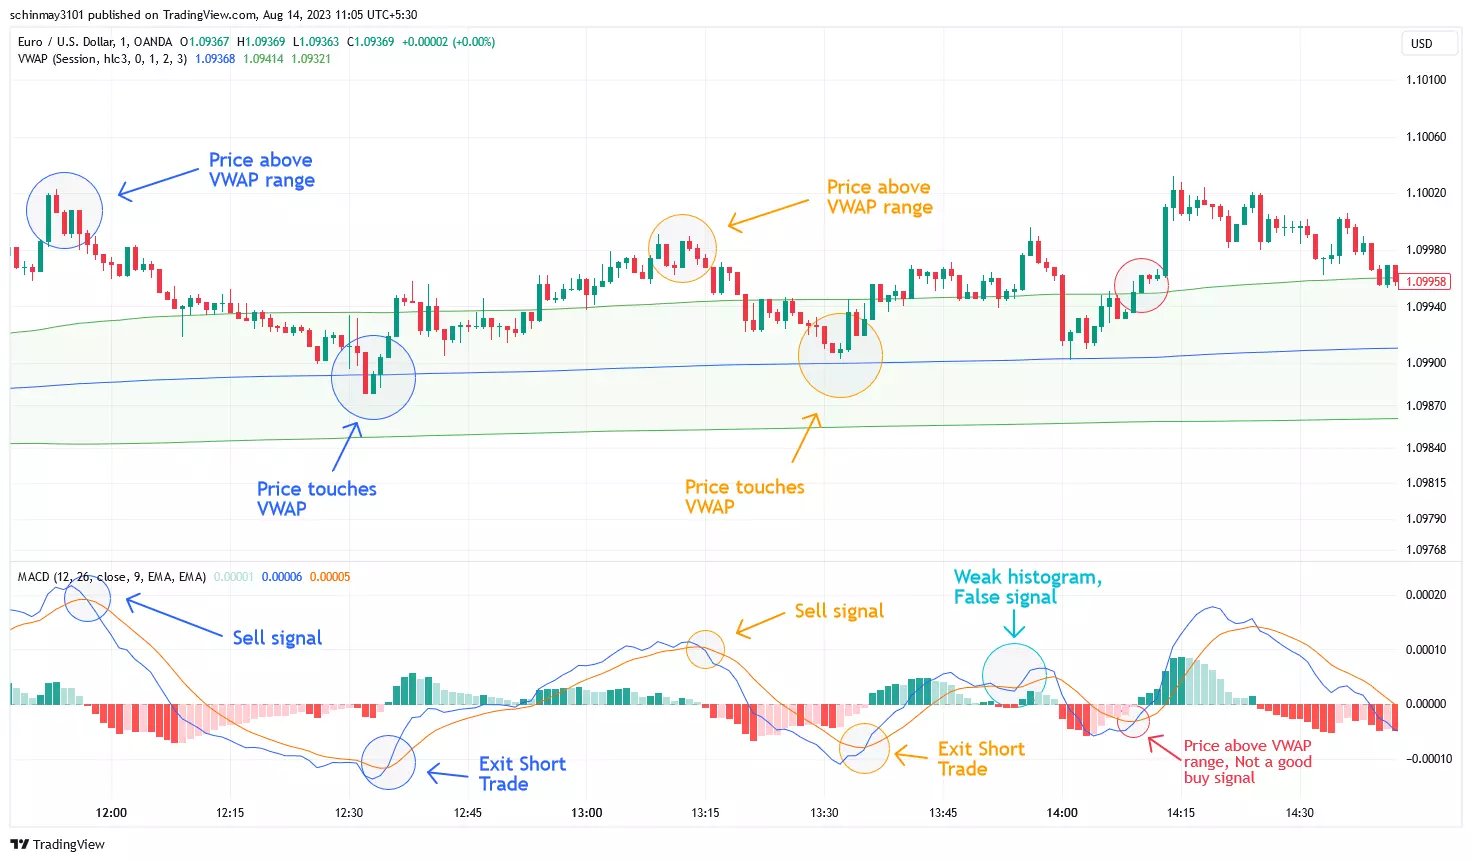
Moving Average Convergence Divergence (MACD): Identifying Trend Changes
The Moving Average Convergence Divergence (MACD) is another popular momentum indicator that shows the relationship between two moving averages of prices. It consists of the MACD line, the signal line, and the histogram. Crossovers between the MACD line and the signal line can be used to generate buy or sell signals. The histogram displays the difference between the two lines, providing a visual representation of the momentum.
The MACD is particularly useful for identifying potential trend changes and confirming the strength of existing trends. Experienced traders often combine the MACD with other indicators, such as volume analysis, to improve the accuracy of their signals.
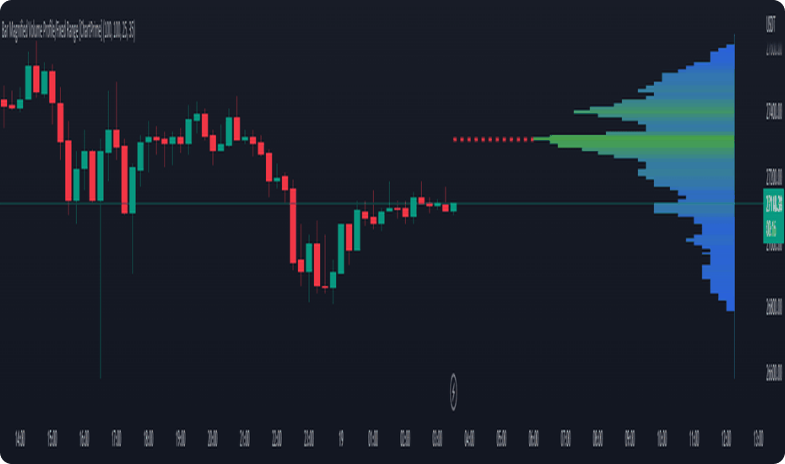
Volume Indicators: Gauging Market Interest
Volume is a crucial component of technical analysis, as it reflects the strength of a price movement. Indicators like On Balance Volume (OBV) and Volume Price Trend (VPT) help traders assess the buying and selling pressure behind price changes. These indicators can confirm trends and identify potential breakouts or breakdowns.
A high volume surge accompanying a price breakout, for example, suggests strong market interest and increases the likelihood of the breakout being sustained. Conversely, a breakout with low volume may be a false signal.
The Importance of Customization and Backtesting
The effectiveness of any technical indicator depends on various factors, including the specific market being traded, the timeframe used, and the individual trader's risk tolerance. It is essential to customize indicator settings to suit individual trading styles and market conditions. Furthermore, backtesting indicators on historical data is crucial to assess their performance and identify potential weaknesses.
Backtesting allows traders to simulate trading strategies using historical data. This is an important step to refine your trading approach.
Conclusion: A Balanced Approach
While TradingView offers a wide range of powerful indicators, it is important to remember that no single indicator is a guaranteed path to success. Day traders should adopt a balanced approach that combines technical analysis with fundamental analysis, risk management, and a thorough understanding of market dynamics. The indicators discussed above can be valuable tools in a day trader's arsenal, but they should be used judiciously and in conjunction with other forms of analysis.