Frequency Distribution Vs Relative Frequency Distribution

In the world of data analysis, understanding the distribution of data is paramount. Two fundamental tools used to achieve this are frequency distribution and relative frequency distribution. While they share a common goal, they offer different perspectives and insights into the data.
This article aims to clarify the differences between these two methods, highlighting their individual strengths and applications. Understanding these distinctions empowers analysts and researchers to draw more informed conclusions from their data.
Defining the Basics
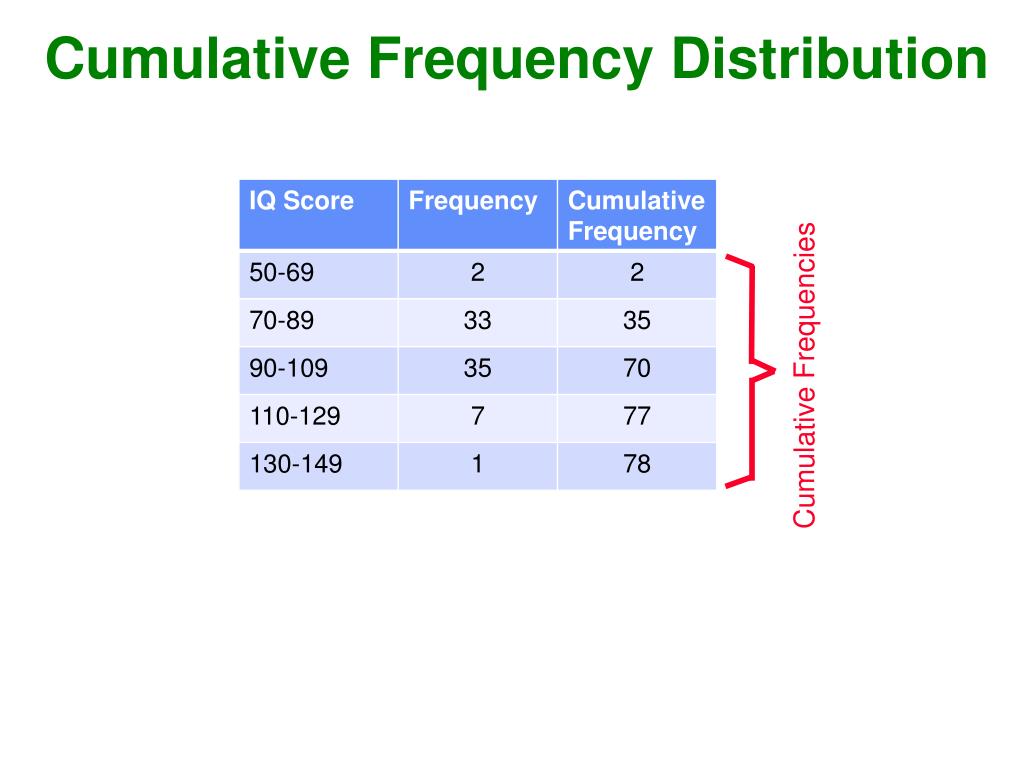
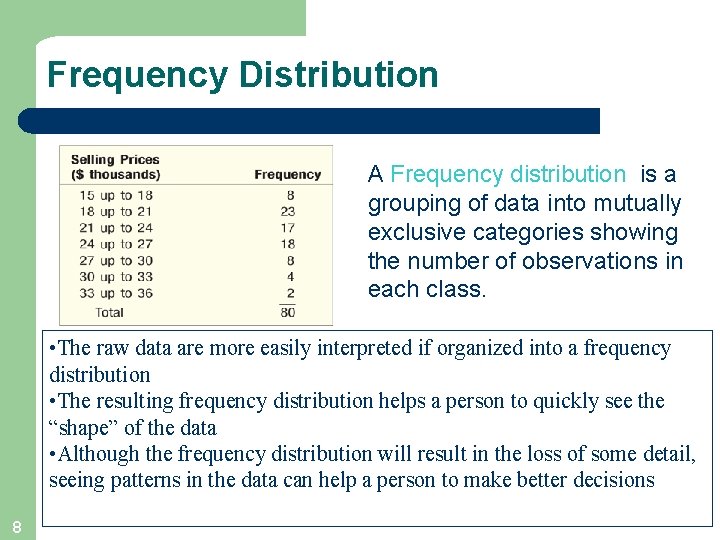
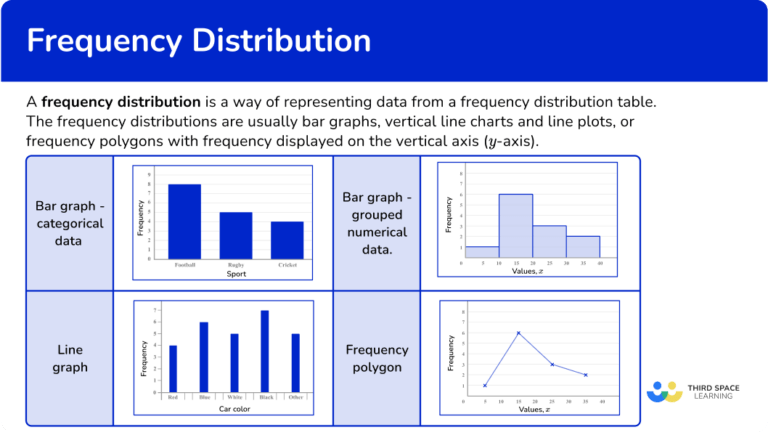
A frequency distribution is a table or chart that shows how many times each value or group of values appears in a dataset. Simply put, it counts the occurrences of each category or data point.
Imagine analyzing the ages of participants in a study. A frequency distribution would show how many participants fall within each age group (e.g., 20-29, 30-39, etc.).
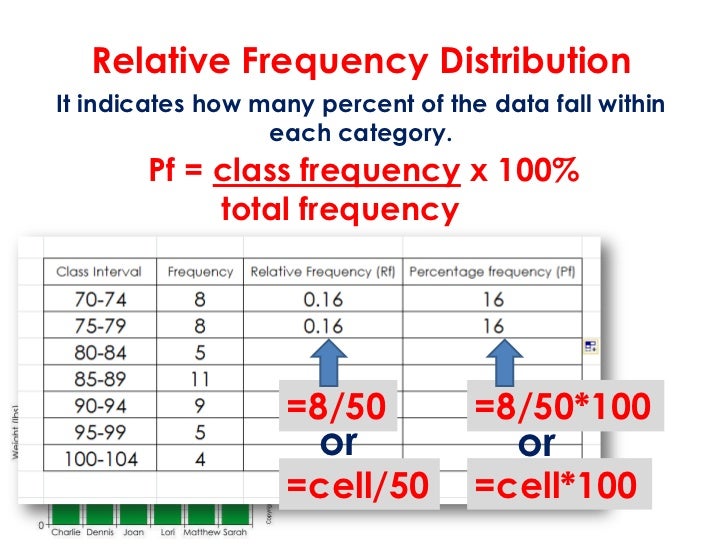
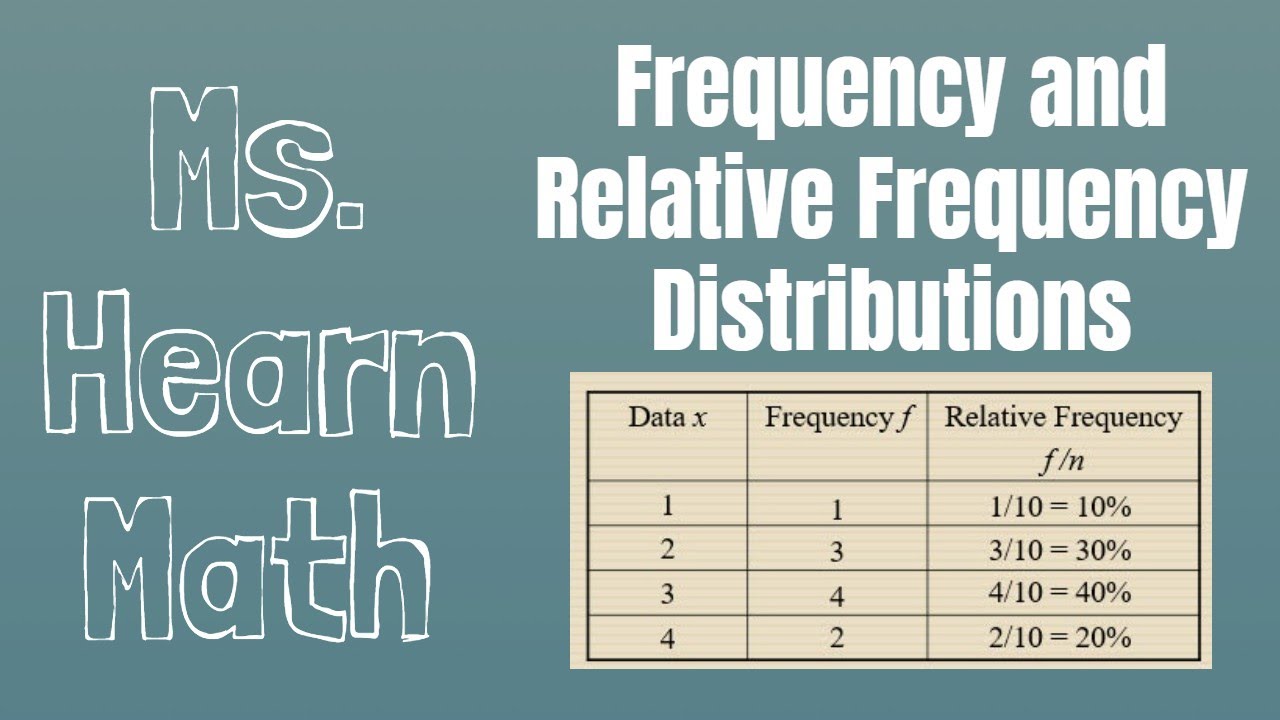
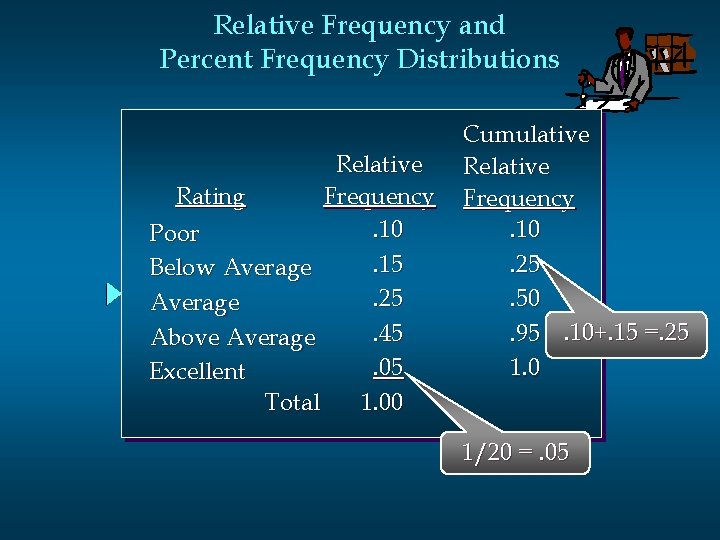
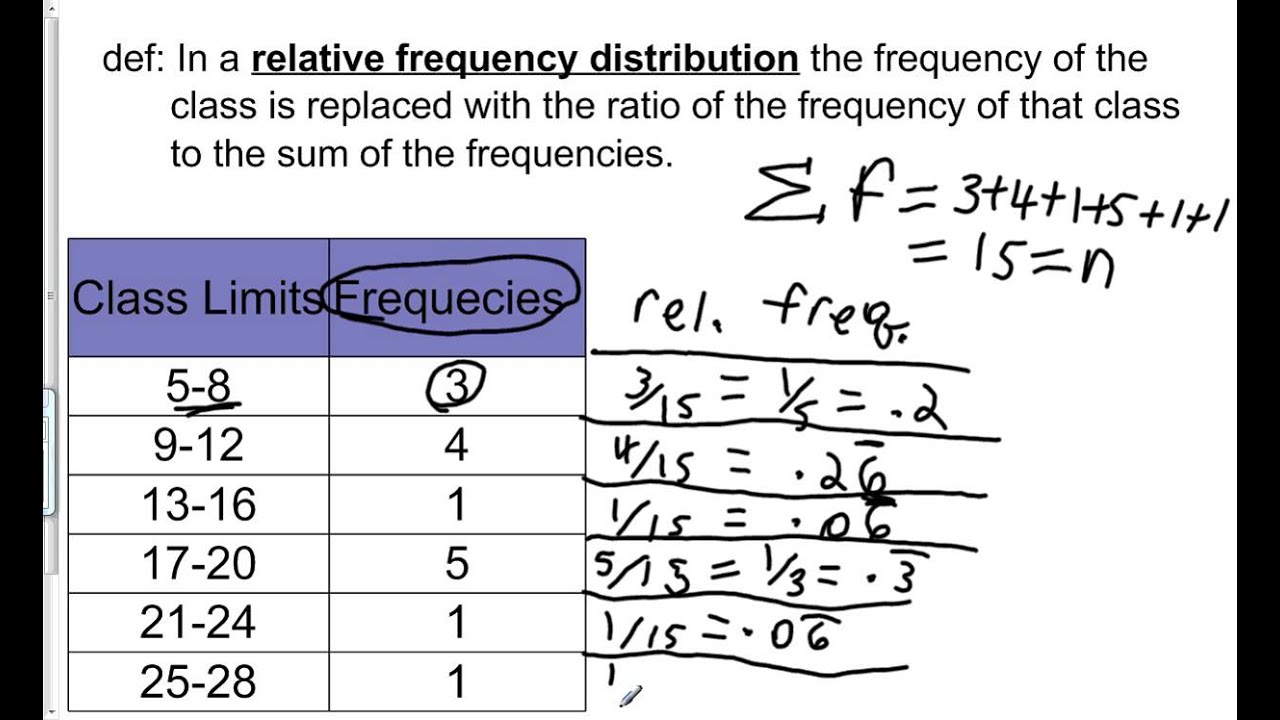
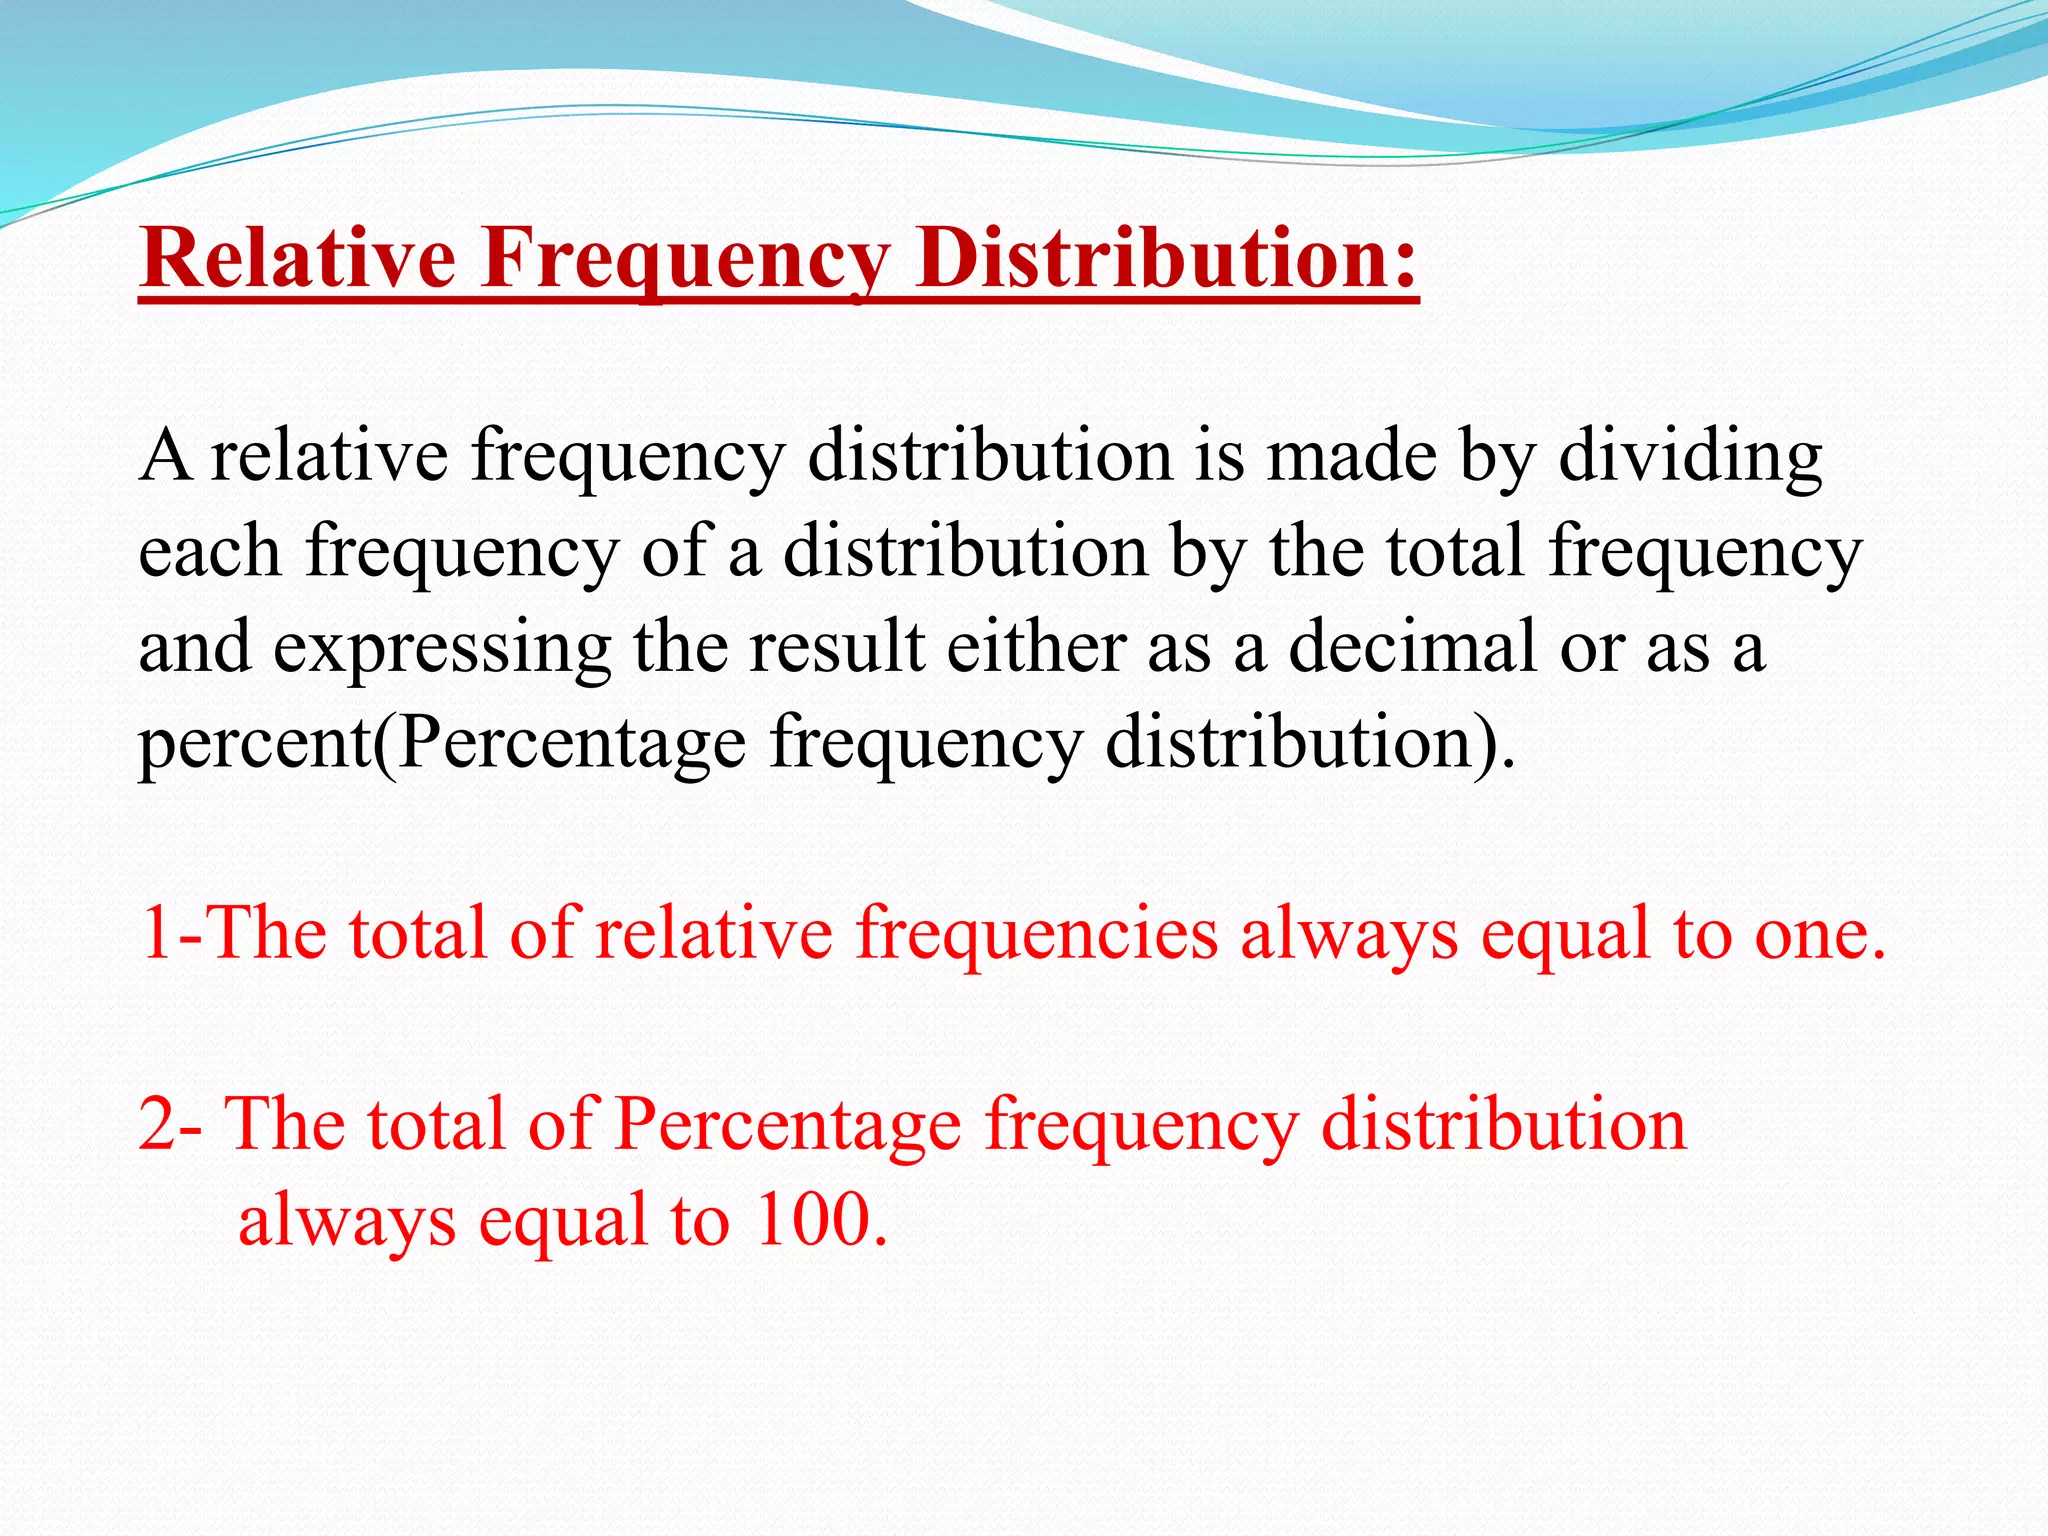
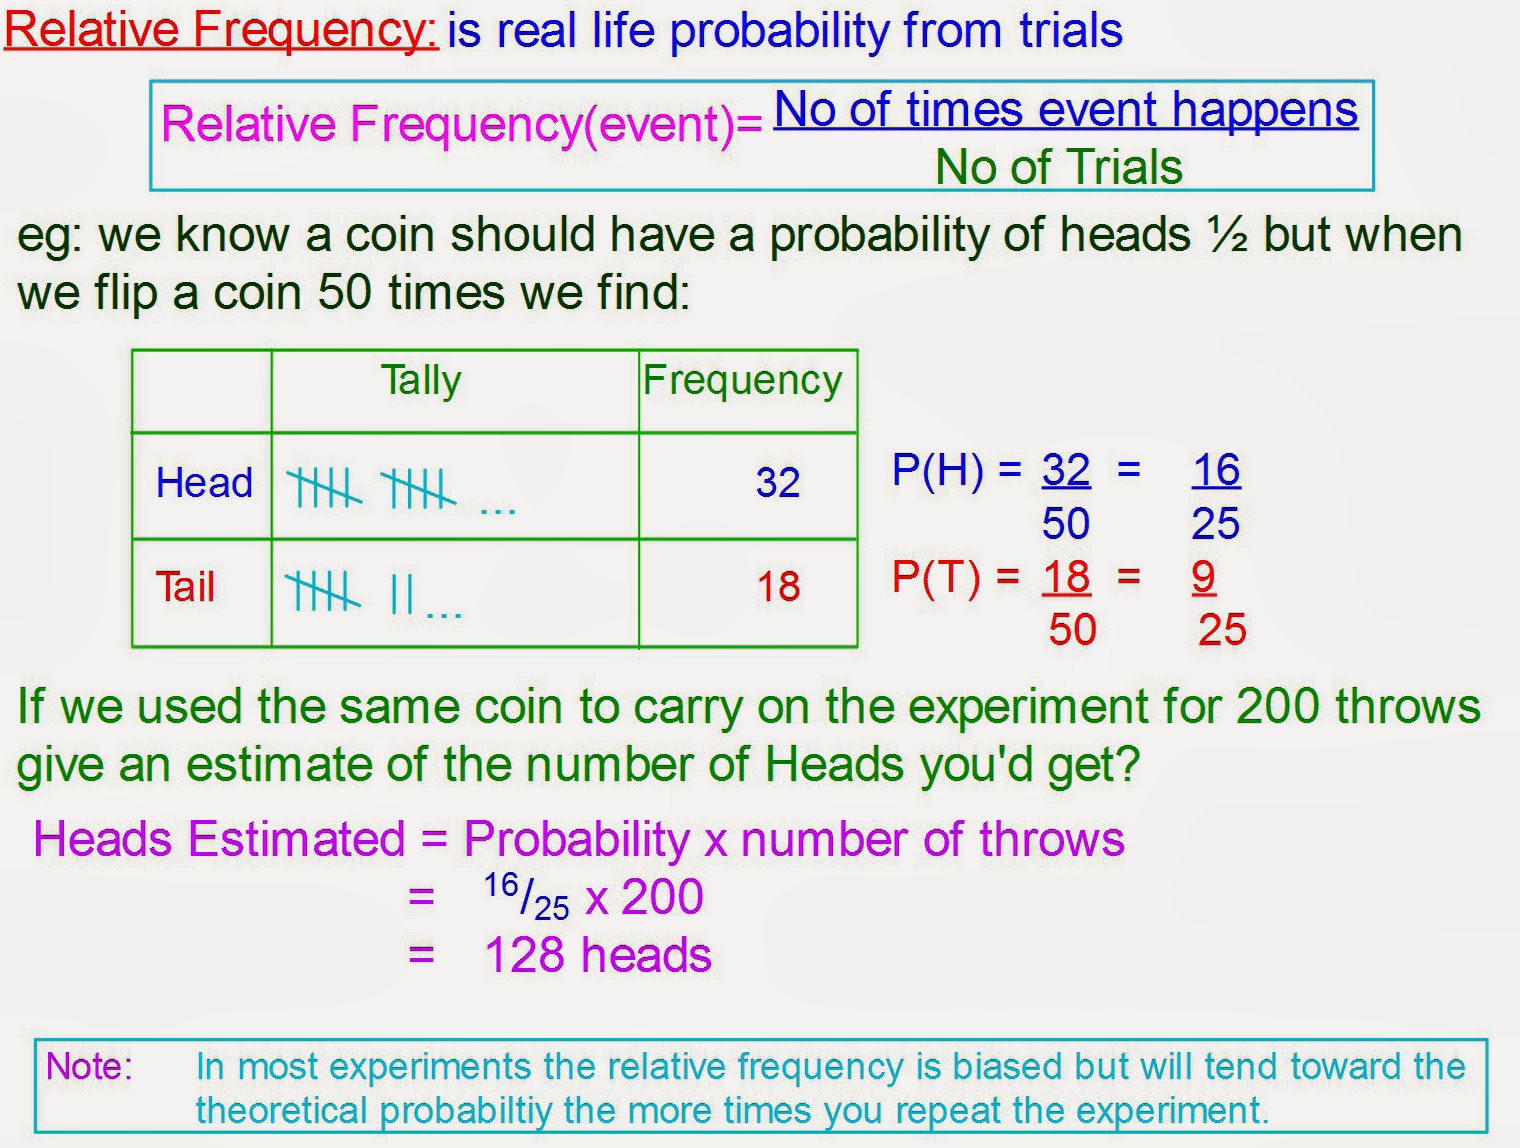
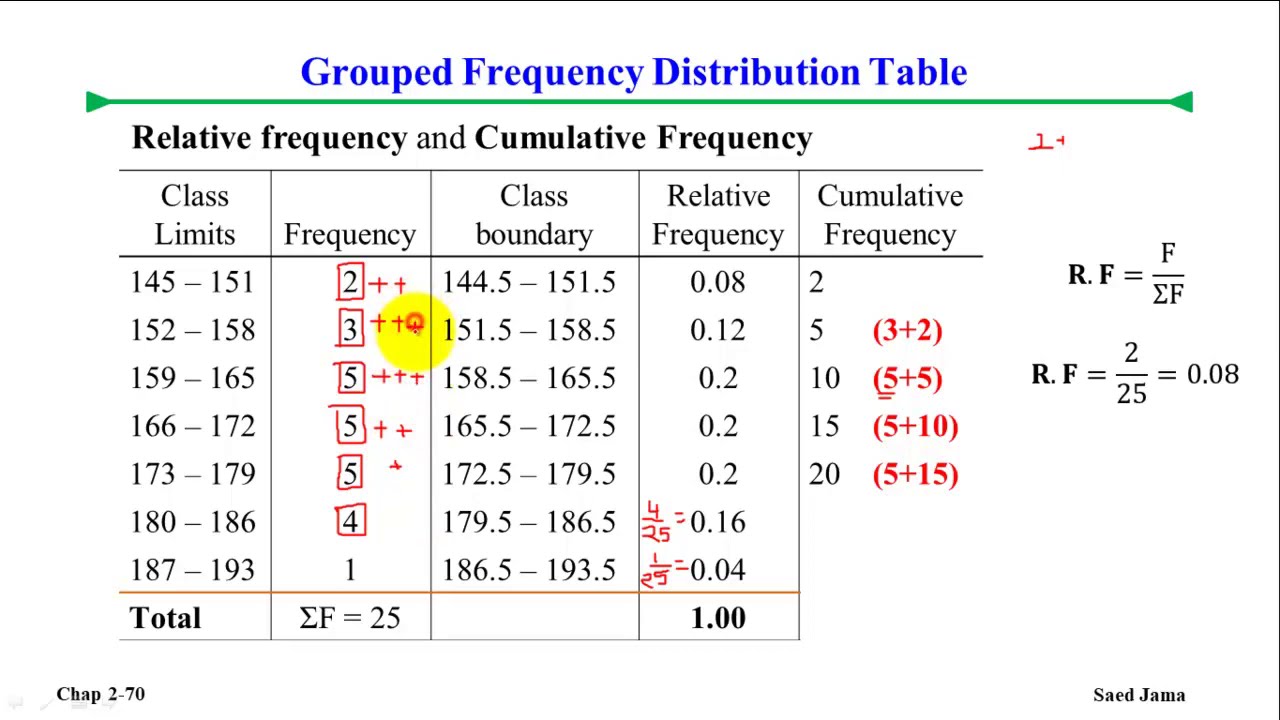
In contrast, a relative frequency distribution displays the proportion or percentage of times each value or group of values appears. This is calculated by dividing the frequency of each category by the total number of observations.
Continuing the age example, a relative frequency distribution would show what percentage of participants are in each age group, instead of the raw count.
Key Differences
The primary difference lies in how the information is presented. A frequency distribution presents raw counts, while a relative frequency distribution presents proportions or percentages.
This seemingly small difference has a significant impact on interpretation. Relative frequency provides a standardized way to compare distributions across datasets of different sizes.
For instance, comparing the age distributions of two studies, one with 100 participants and another with 1000, becomes much easier with relative frequencies. You can directly compare the percentages in each age group.
Practical Applications
Both frequency and relative frequency distributions find applications across various fields. In market research, they can be used to analyze customer demographics or product preferences.
In healthcare, they might be used to track the prevalence of diseases or the effectiveness of treatments across different patient groups.
In education, they can help educators understand the distribution of student grades or performance levels on standardized tests.
Advantages and Disadvantages
Frequency distributions are straightforward and easy to create, providing a clear picture of the raw counts. However, they can be misleading when comparing datasets of different sizes, as mentioned before.
Relative frequency distributions overcome this limitation by providing standardized proportions, making comparisons easier. They also offer a more intuitive understanding of the data's distribution, especially for large datasets.
However, they might obscure the actual sample size. Knowing that 50% of participants fall into a particular category is useful, but it doesn't tell you if that's 50 out of 100 or 500 out of 1000.
Example Scenario
Imagine a survey asking respondents about their preferred mode of transportation. The results might show that 50 people prefer cars, 30 prefer public transport, and 20 prefer cycling.
The frequency distribution would simply present these raw numbers: 50, 30, and 20.
The relative frequency distribution would present these as percentages: 50% prefer cars, 30% prefer public transport, and 20% prefer cycling. This makes it easier to understand the relative popularity of each mode of transportation.
Conclusion
Both frequency and relative frequency distributions are valuable tools for understanding and summarizing data. The choice between them depends on the specific research question and the context of the analysis.
Frequency distributions provide a clear view of raw counts, while relative frequency distributions offer standardized proportions for easier comparison across datasets of different sizes.
By understanding the strengths and limitations of each method, analysts can make more informed decisions and draw more accurate conclusions from their data, ultimately leading to better insights and outcomes.