How To Calculate Average Operating Assets

Imagine you're standing in the heart of a bustling marketplace. Vendors are displaying their wares, customers are haggling over prices, and money is constantly changing hands. Each vendor manages their inventory, their stall, and their cash – all assets that help them generate income. Just like these vendors, businesses need to understand how their assets are working for them. The key to understanding this lies in knowing how to calculate average operating assets.
The average operating assets figure provides a valuable insight into a company’s efficiency. It’s a measure of the average investment a company has in its operational resources during a specific period. This figure is used to assess how effectively a company utilizes its assets to generate revenue and profit.
What are Operating Assets?
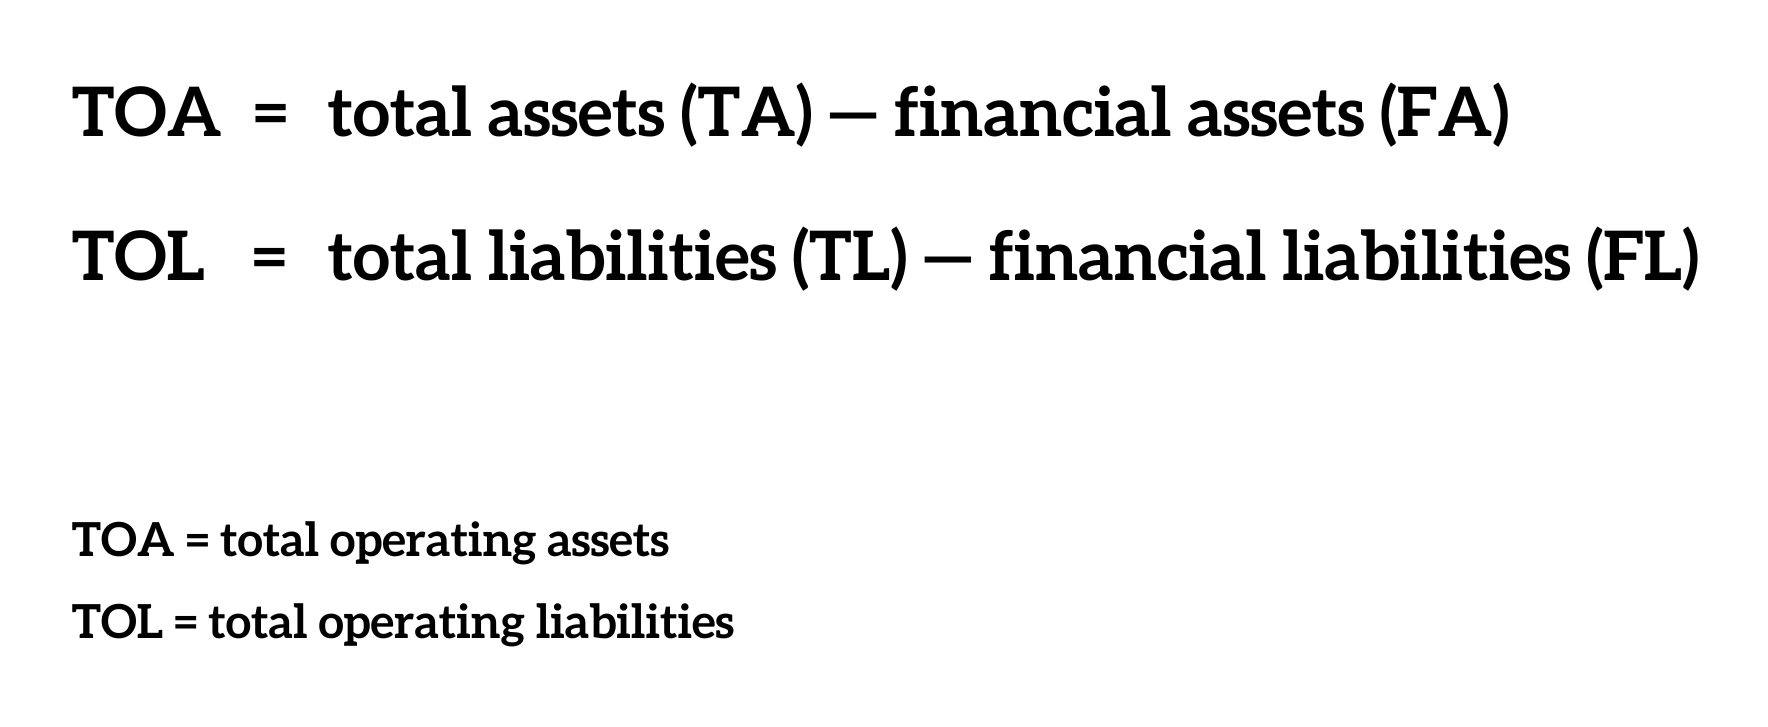
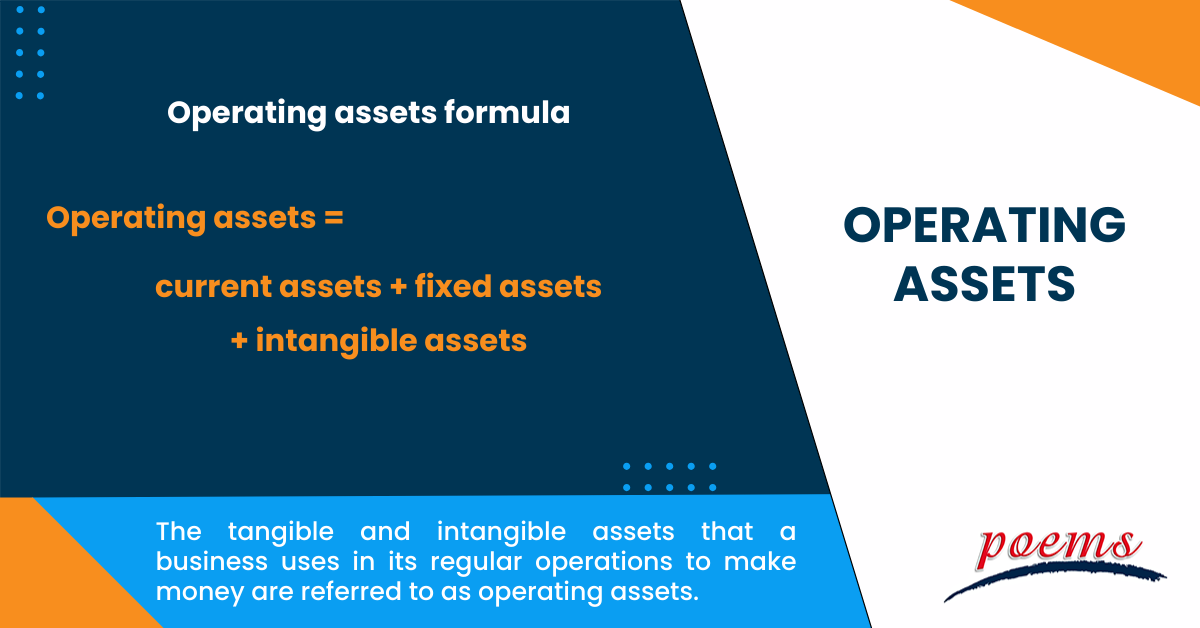
Operating assets are the resources a company uses to generate its primary revenue. These are distinct from non-operating assets, which are typically investments or other holdings not directly tied to the core business operations. Understanding the difference is crucial.
Examples of Operating Assets
Operating assets can be categorized into a few key areas. These include cash, accounts receivable, inventory, and prepaid expenses. Property, plant, and equipment (PP&E) are also considered operating assets, as these are the physical resources used to produce goods or services.
Cash is readily available for daily operations. Accounts receivable represents money owed to the company by customers. Inventory is the raw materials, work-in-progress, and finished goods held for sale. Prepaid expenses are payments made in advance for goods or services.
Examples of Non-Operating Assets
Non-operating assets generally include investments, marketable securities, and land held for future use. These assets do not directly contribute to the company's primary operations. These are often held for investment income or long-term appreciation.
For example, a manufacturing company might have a vacant lot adjacent to its factory. This lot is considered a non-operating asset if it’s not currently being used for production.
Calculating Average Operating Assets: The Formula
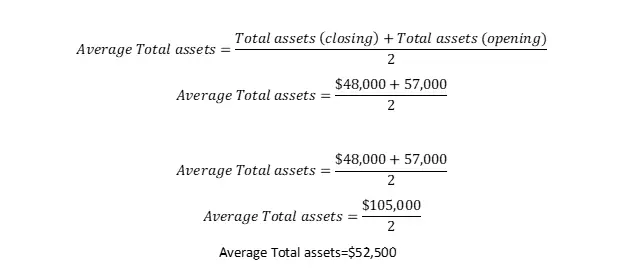
The formula for calculating average operating assets is straightforward: Average Operating Assets = (Beginning Operating Assets + Ending Operating Assets) / 2. This simple calculation provides a representative figure for the period in question.
First, you need to identify the total operating assets at the beginning of the period, and then at the end. Add these two figures together. Then, divide the sum by two.
Step-by-Step Calculation
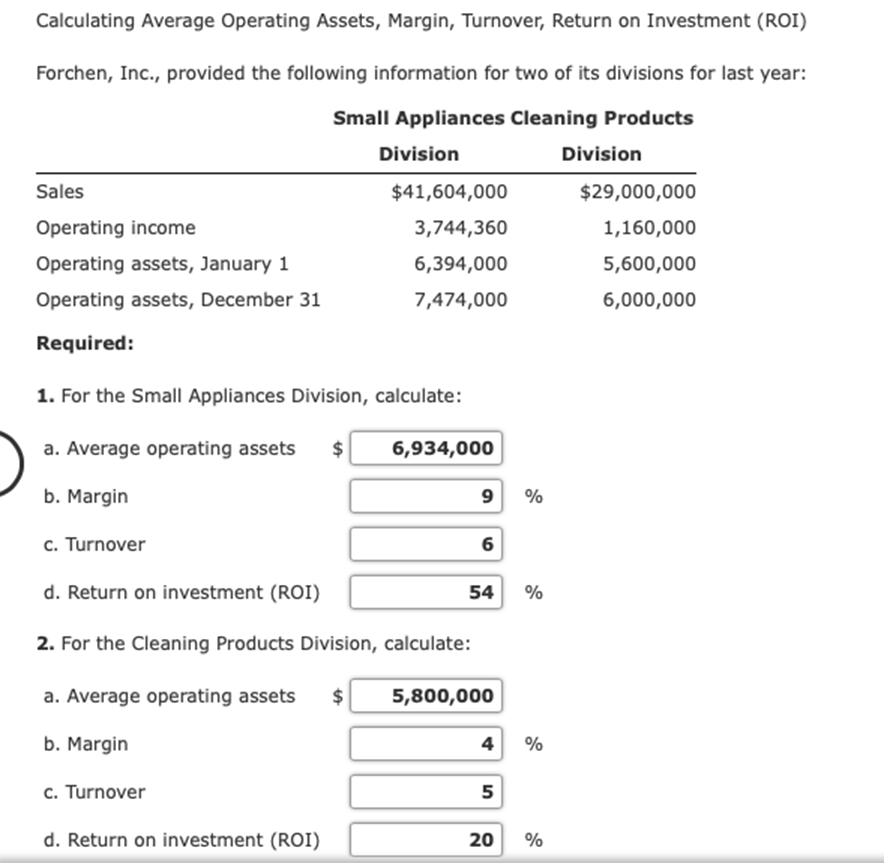
Let's walk through a practical example. Suppose a company started the year with $500,000 in operating assets and ended the year with $700,000. To calculate the average operating assets, you would add $500,000 and $700,000 to get $1,200,000. Then, you would divide $1,200,000 by 2, resulting in $600,000.
Thus, the average operating assets for the year would be $600,000. This calculation provides a baseline for understanding how effectively the company is using its resources. This also helps in further financial analysis.
Finding the Data
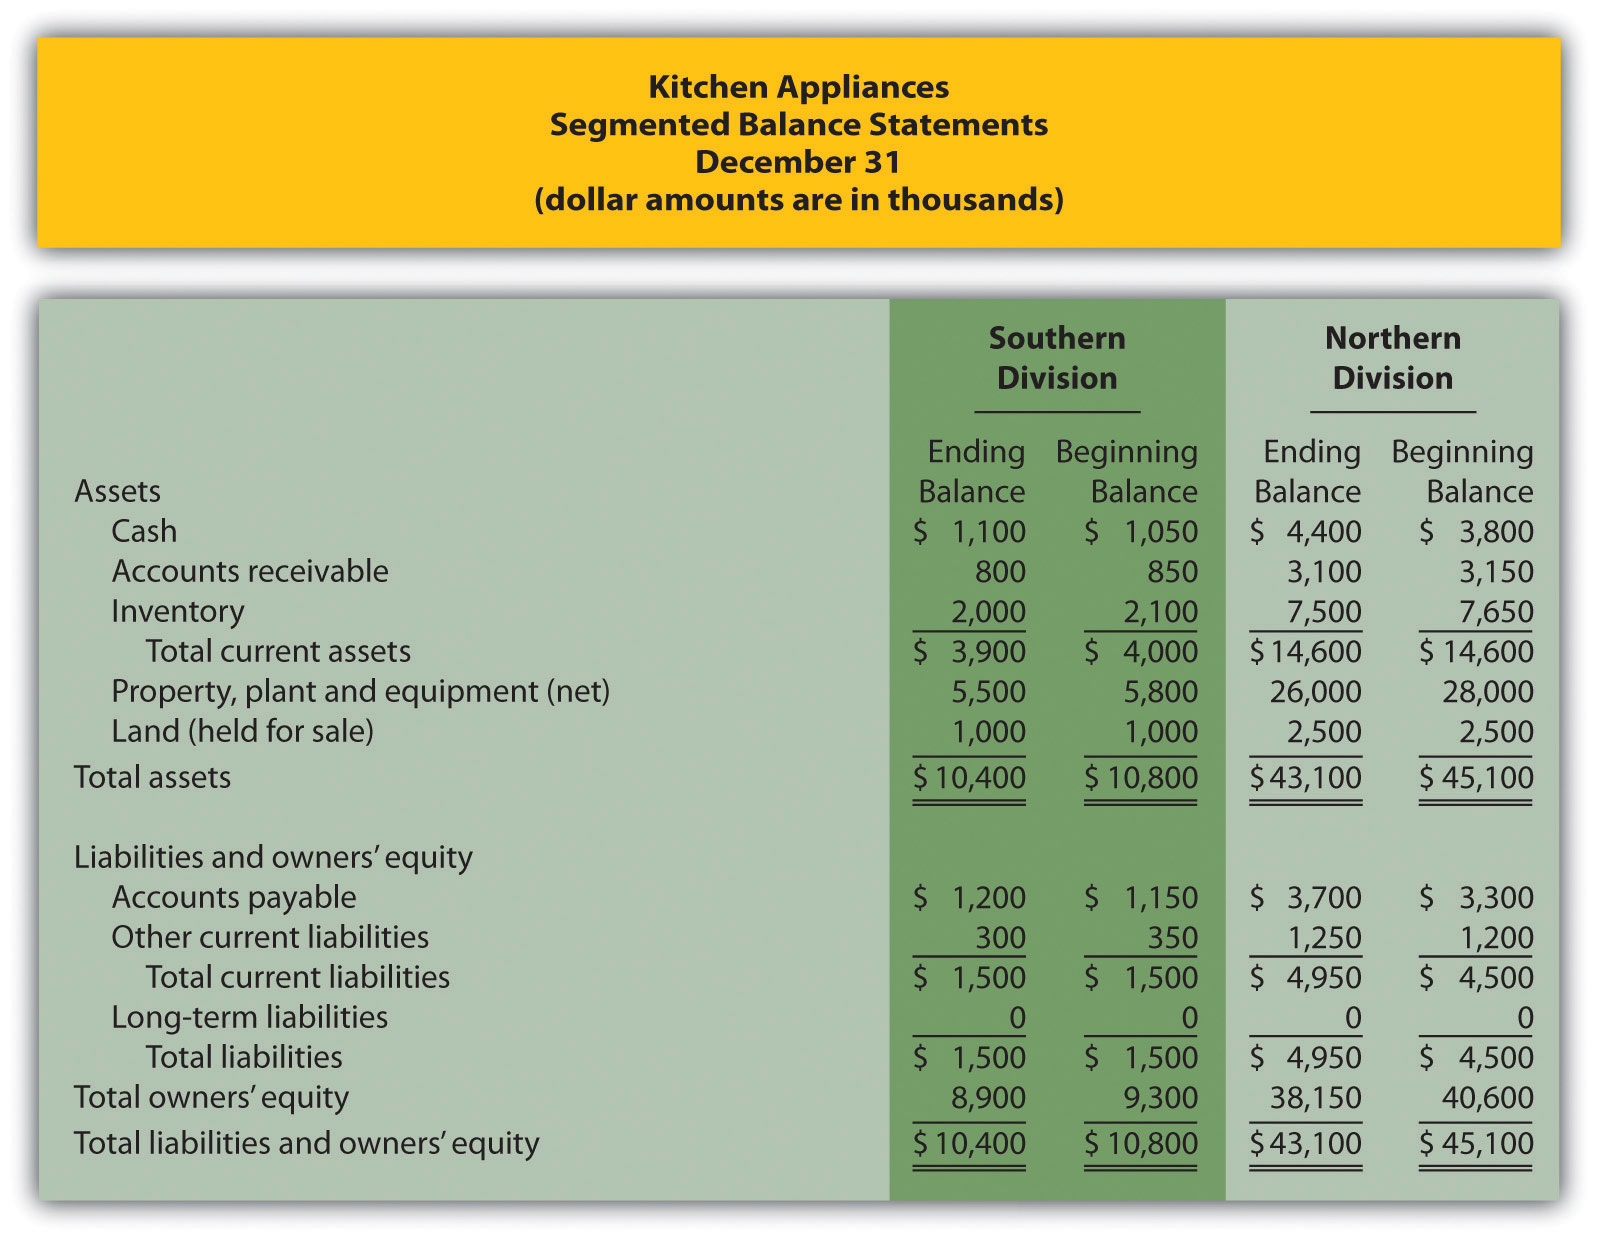
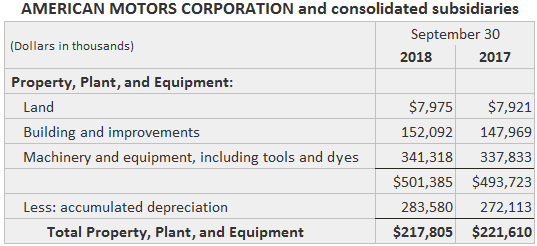
The data needed to calculate average operating assets is typically found on a company’s balance sheet. The balance sheet provides a snapshot of a company's assets, liabilities, and equity at a specific point in time.
You'll need to examine the balance sheets from the beginning and end of the period you're analyzing. From there, you can identify and total all the operating assets. This will give you the figures you need to plug into the formula.
Why is Average Operating Assets Important?
The average operating assets figure is vital for several reasons. It is used in calculating key financial ratios. These ratios are used to evaluate a company's performance and efficiency.
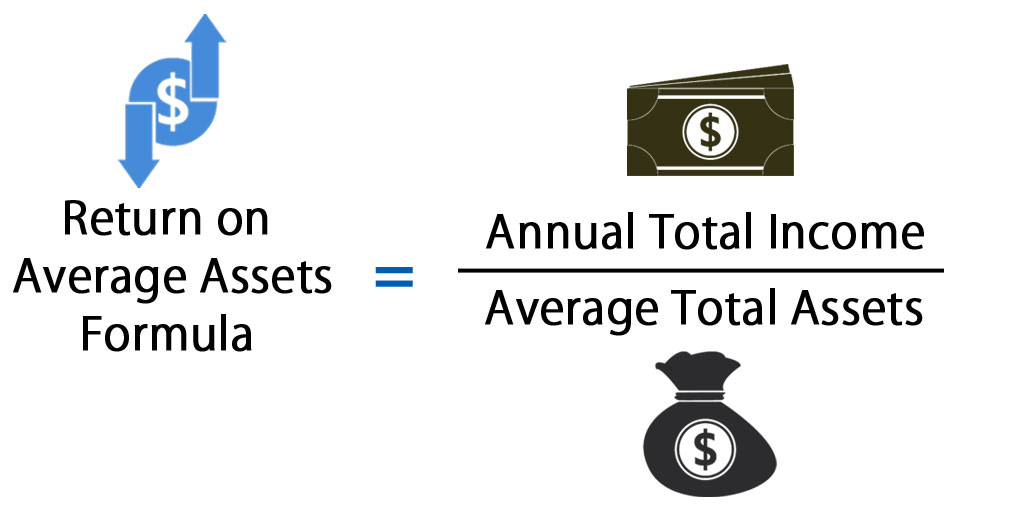
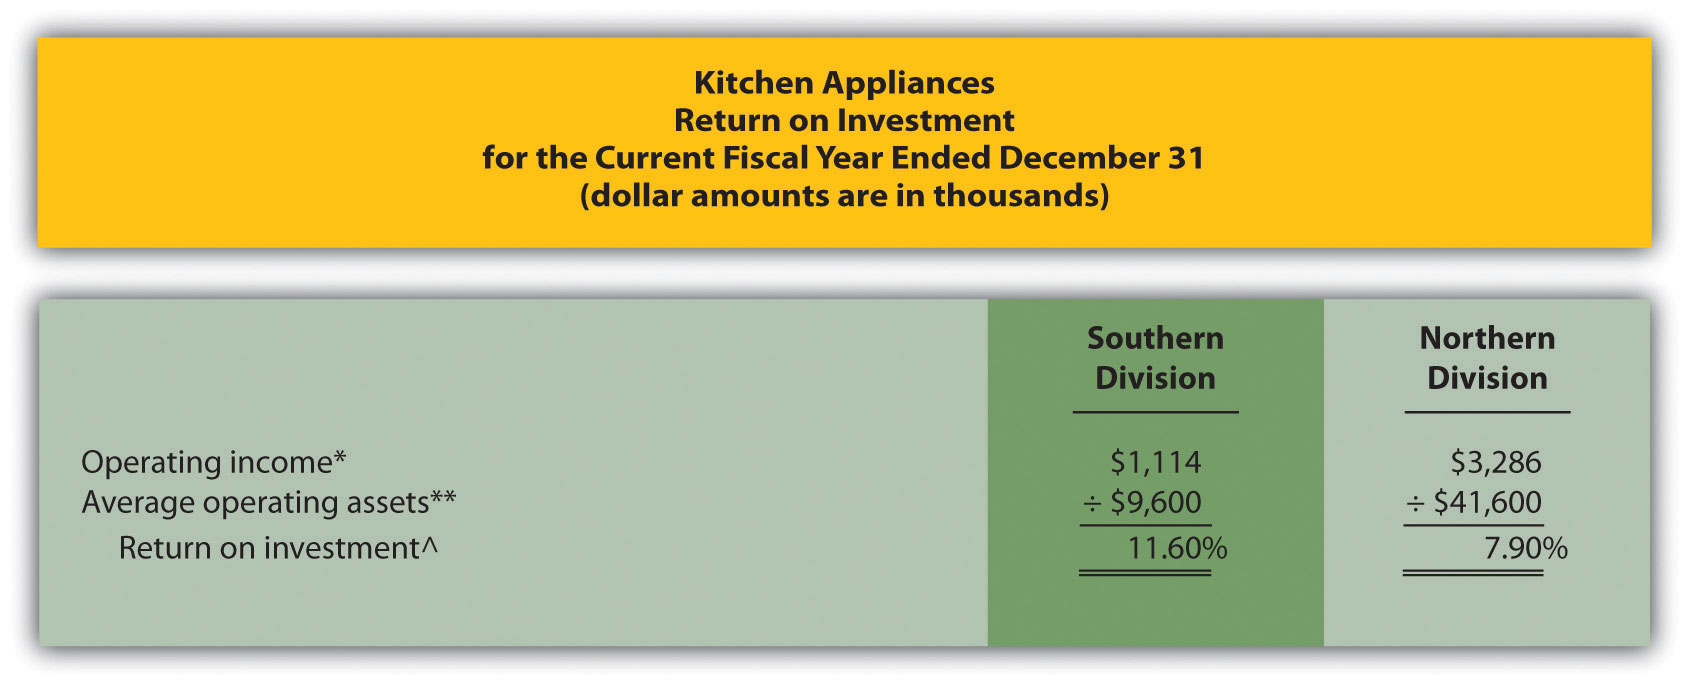
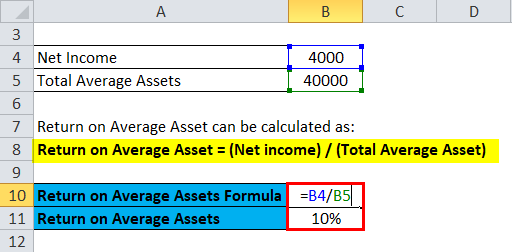
One of the most important uses of average operating assets is in calculating the Return on Assets (ROA). ROA measures how effectively a company is using its assets to generate profit. The formula for ROA is: ROA = Net Income / Average Total Assets.
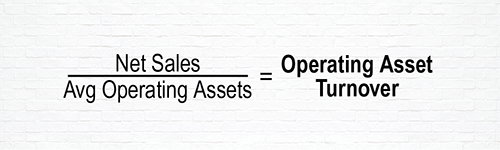
Another use is calculating the Asset Turnover Ratio. The Asset Turnover Ratio measures how efficiently a company is using its assets to generate sales. The formula for Asset Turnover Ratio is: Asset Turnover Ratio = Net Sales / Average Total Assets.
Evaluating Efficiency
A higher ROA indicates that a company is generating more profit per dollar of assets. A higher Asset Turnover Ratio suggests that a company is generating more sales per dollar of assets. These are all indicators of good operational efficiency.
By tracking these ratios over time, you can identify trends. Then, you can assess whether a company is becoming more or less efficient in its asset utilization.
Benchmarking Against Competitors
Average operating assets can also be used to benchmark a company’s performance against its competitors. By comparing ratios like ROA and Asset Turnover Ratio with those of other companies in the same industry, you can gain valuable insights into relative performance.
If a company has a lower ROA or Asset Turnover Ratio than its competitors, it may indicate that the company needs to improve its asset management practices. This can lead to operational improvements. This comparative analysis can inform strategic decisions.
Limitations of the Calculation
While the average operating assets calculation is useful, it’s important to be aware of its limitations. The calculation is simply an average. Thus, it may not fully reflect significant fluctuations in asset levels during the period.
For example, if a company made a major asset purchase halfway through the year, the average operating assets figure may not accurately represent the company’s asset base for the entire year. In such cases, a more detailed analysis may be required.
Industry-Specific Considerations
The interpretation of average operating assets and related ratios can vary depending on the industry. Industries with high capital intensity, such as manufacturing or energy, typically have higher levels of operating assets compared to service-based industries.
Therefore, it’s crucial to consider the specific characteristics of the industry when analyzing a company’s asset utilization. What is considered an efficient level of assets in one industry may be inefficient in another. Always consider the context.
Conclusion
Calculating average operating assets is a fundamental step in understanding a company’s financial health and operational efficiency. By knowing this simple yet powerful calculation, one can gain a deeper understanding of how efficiently a company utilizes its resources to generate revenue and profit.
It is a starting point for further analysis. When combined with other financial metrics, it can provide a comprehensive view of a company’s performance. It’s a valuable tool for investors, analysts, and business managers alike.
Just like those market vendors who diligently manage their stalls, businesses thrive by understanding and optimizing their assets. So, take a moment to appreciate the power of this simple calculation, and use it to unlock new insights into the world of finance.