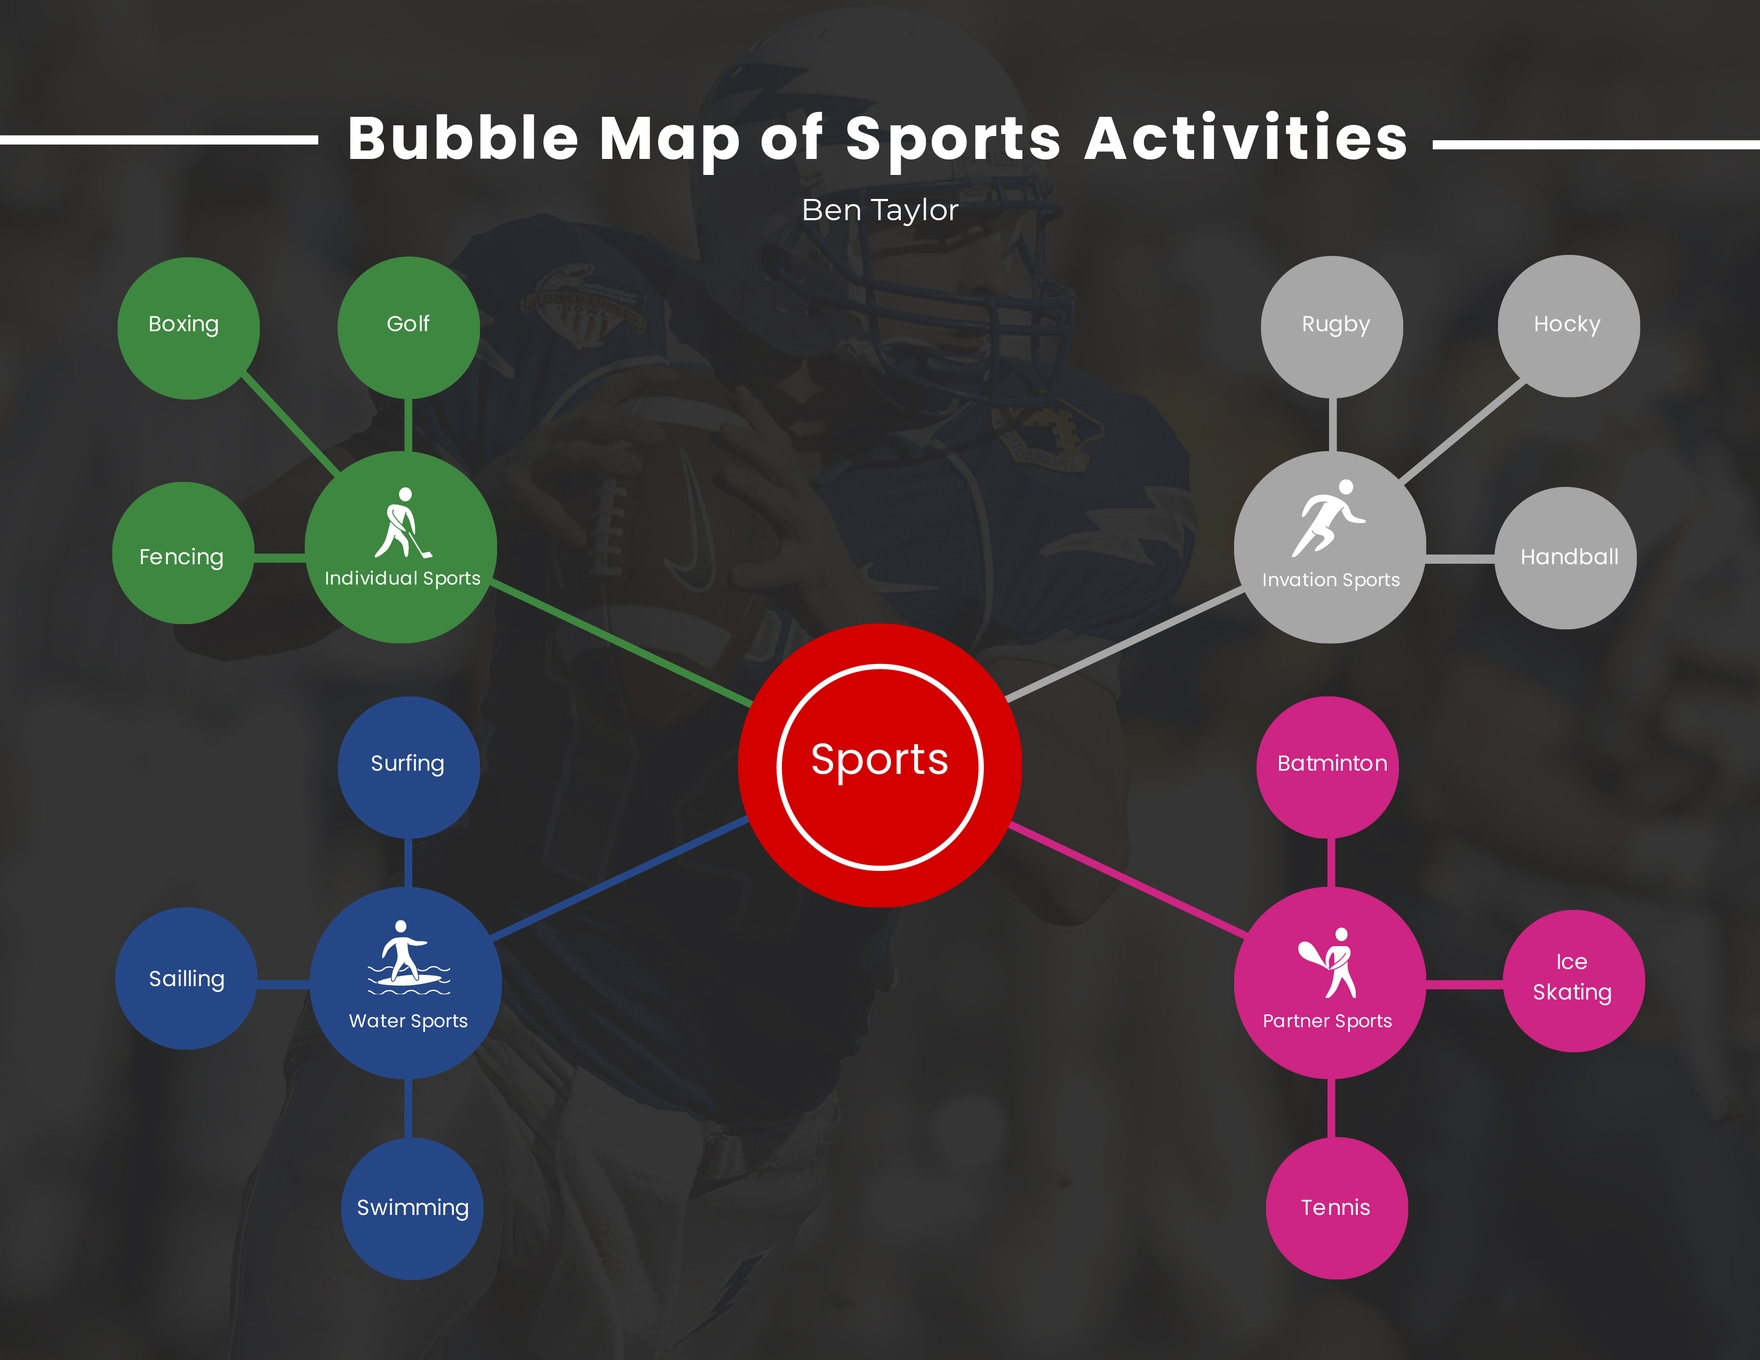
How To Make A Bubble Map On Google Docs
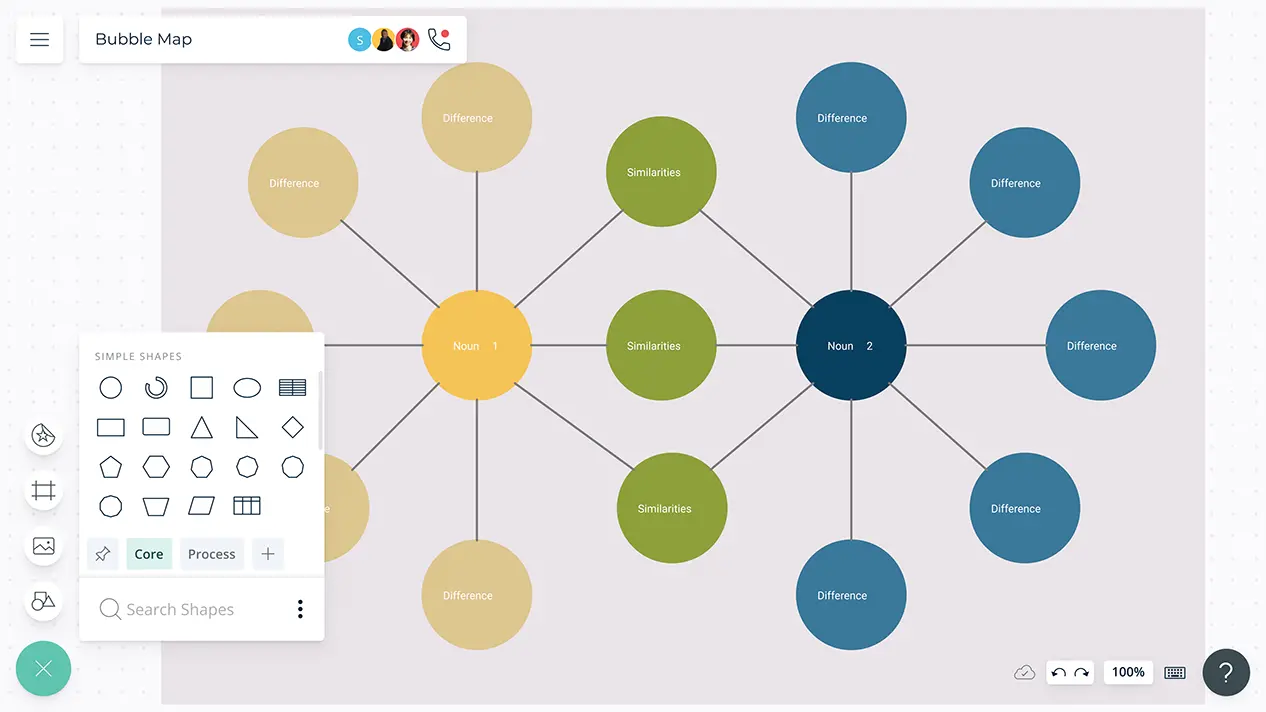
In an increasingly interconnected world, the ability to effectively visualize and organize information is paramount. Professionals, students, and researchers alike are constantly seeking efficient tools to structure complex ideas and facilitate brainstorming. Google Docs, a ubiquitous platform for collaborative document creation, offers a surprising degree of flexibility when it comes to visual mapping, although it doesn't have a dedicated bubble map feature.
This article provides a comprehensive guide on how to craft a compelling bubble map directly within Google Docs, leveraging its drawing tools and formatting options. We will explore step-by-step instructions, practical tips, and alternative approaches to ensure your bubble map is not only visually appealing but also effectively communicates your intended message. Let's dive into the process of turning your text-based document into a dynamic visual representation.
Creating a Bubble Map: A Step-by-Step Guide
Step 1: Accessing the Drawing Canvas
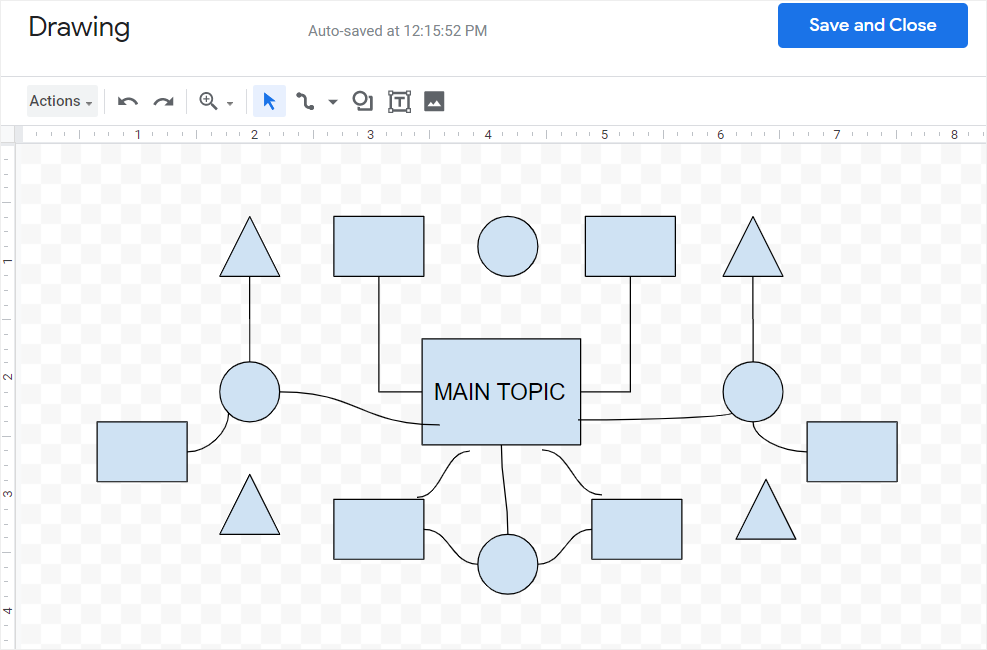
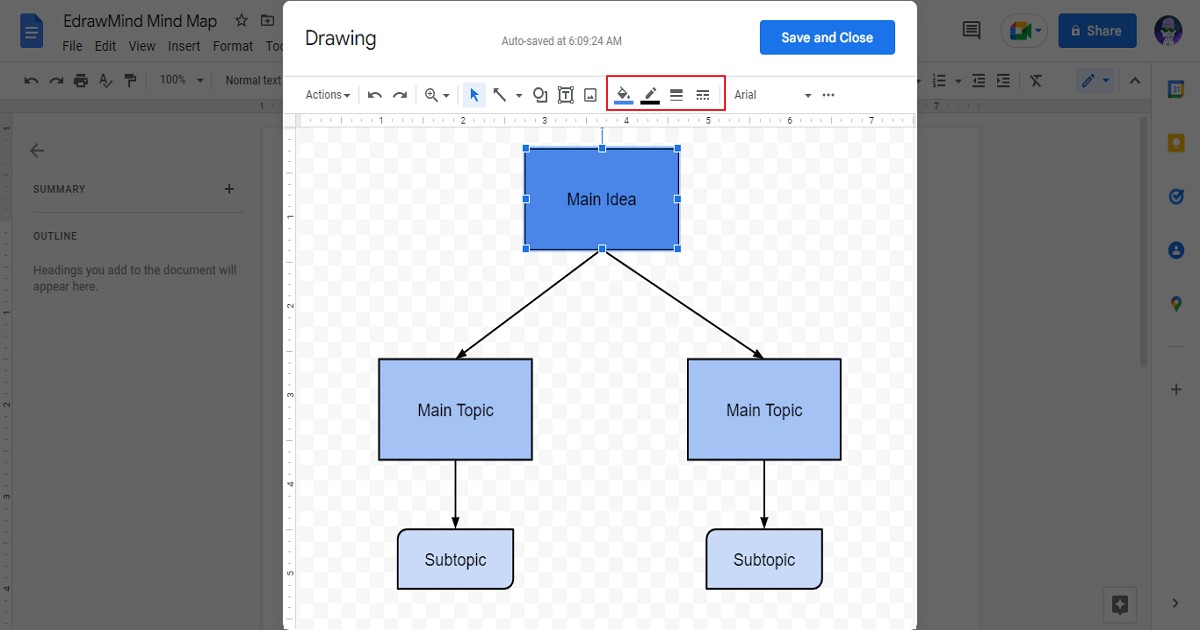
Begin by opening your Google Docs document where you want to insert the bubble map. Next, navigate to the 'Insert' menu at the top of the screen and select 'Drawing' then 'New'. This action will open a fresh drawing canvas where you can begin constructing your visual representation.
Step 2: Creating the Central Idea
The core of any bubble map is the central idea, the main topic around which all other ideas will revolve. Use the 'Shape' tool in the drawing toolbar to create a circle or oval. Ensure the shape is large enough to accommodate your central idea text.
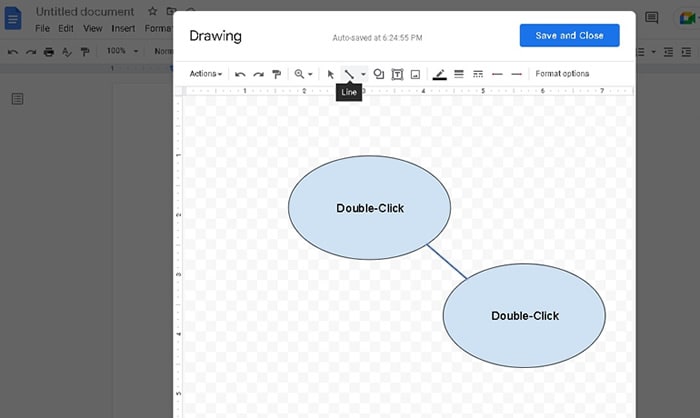
Double-click inside the shape to add your central idea. Use the formatting options in the toolbar to adjust the font, size, and color to make it stand out.
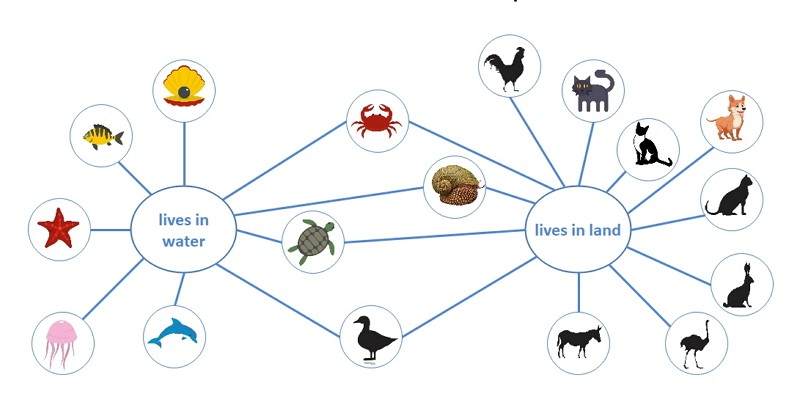
Step 3: Adding the First-Level Bubbles
Now, add the first layer of bubbles representing the main subtopics or related ideas. Use the 'Shape' tool again to create more circles or ovals around the central bubble. Link these bubbles to the central bubble using the 'Line' tool.
Click on the 'Line' tool, then click and drag from the edge of the central bubble to the edge of a subtopic bubble. Repeat this process for each first-level bubble. Remember to adjust the line thickness and color for clarity.
Step 4: Populating the Bubbles
Double-click inside each of the first-level bubbles to add the corresponding text. Just as with the central idea, adjust the font, size, and color for readability and emphasis. Consider using a different color for each level of bubbles to improve visual organization.
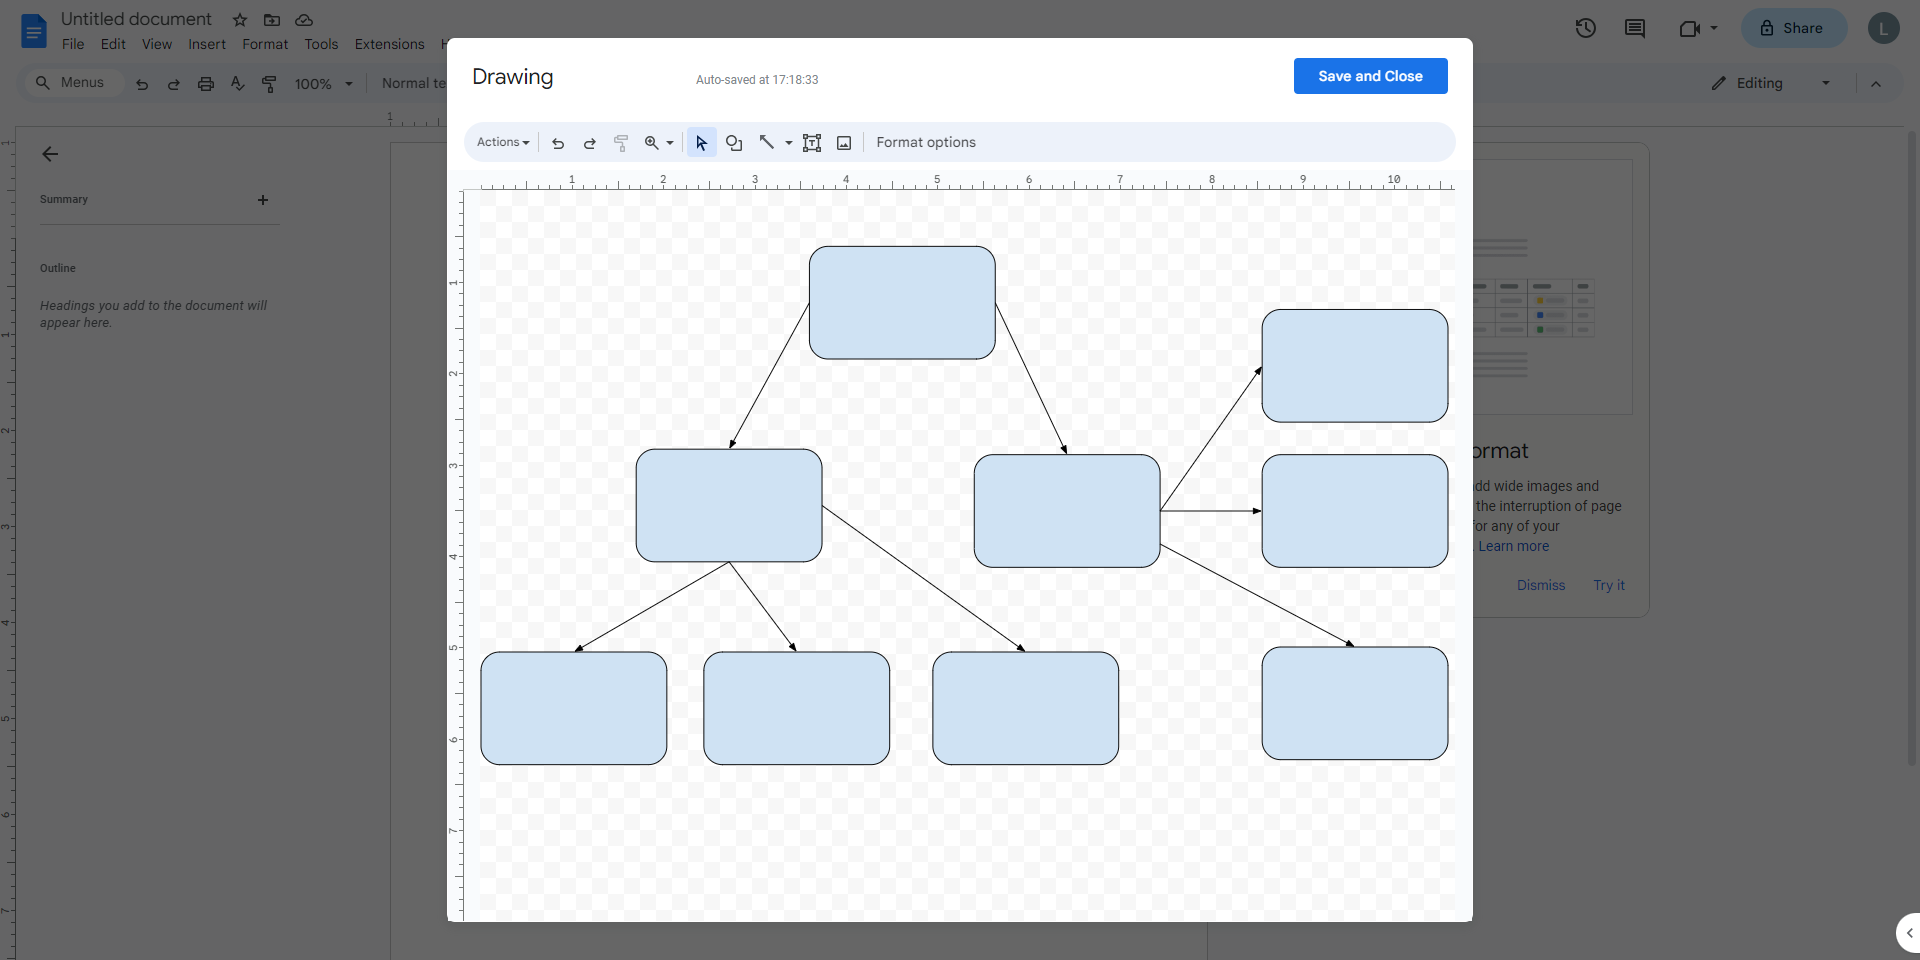
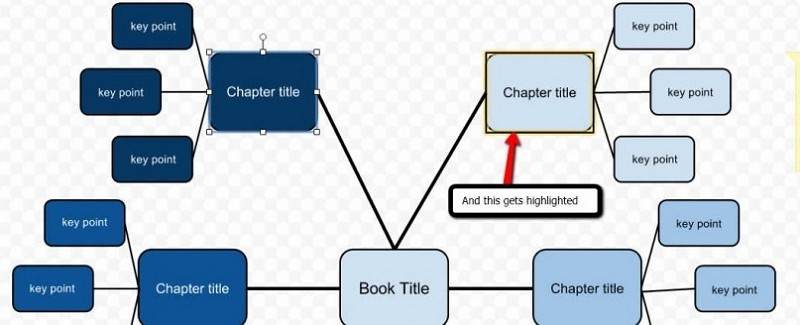
Step 5: Adding Subsequent Levels (If Necessary)
If your ideas require further categorization, you can add subsequent levels of bubbles branching out from the first-level bubbles. Repeat the process from step 3 and 4. Use smaller bubbles and thinner lines for these secondary levels to maintain a clear hierarchy.
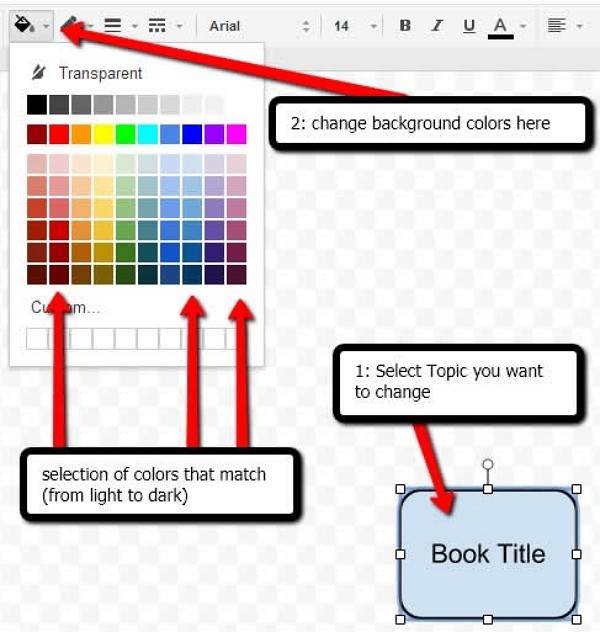
Step 6: Customizing and Refining
Google Docs drawing tools offer a variety of customization options to enhance the visual appeal of your bubble map. You can change the fill color of the bubbles, adjust the line styles, add arrows to the lines, and even insert images.
Experiment with different color schemes and layouts to find what works best for your specific needs. Consider adding labels or legends to further clarify the relationships between ideas.
Alternative Approaches and Considerations
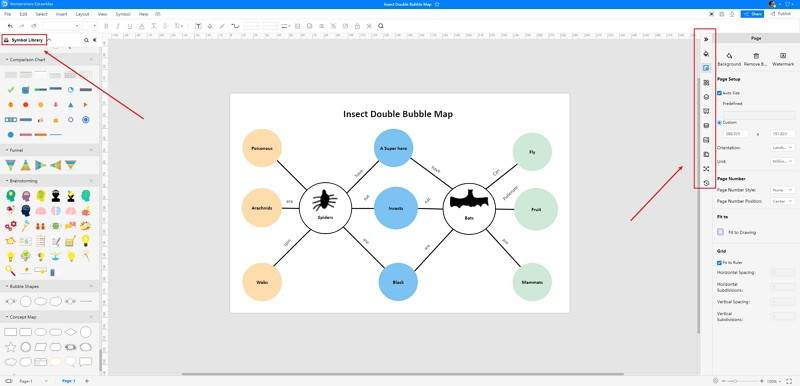
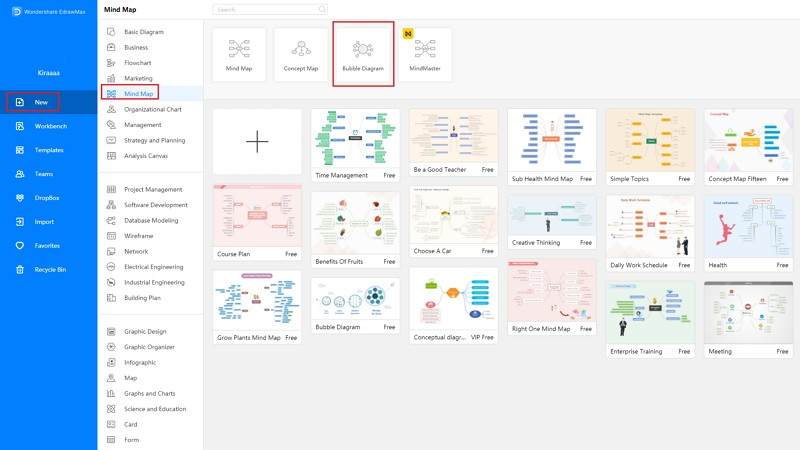
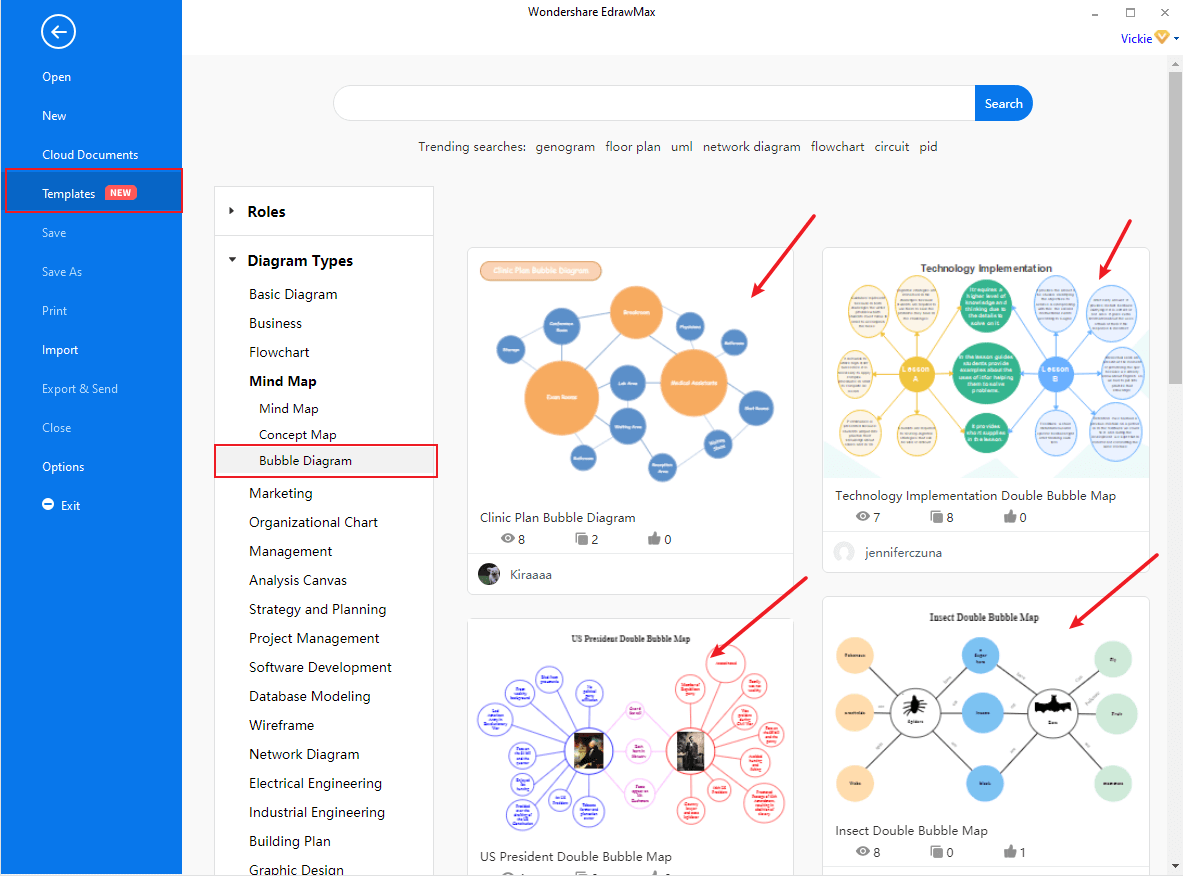
While the drawing tools in Google Docs provide a way to create bubble maps, they are not specifically designed for this purpose. Therefore, the process can be somewhat manual and time-consuming. Consider using dedicated mind mapping software or online tools for more complex or frequently used bubble maps.
Tools like MindMeister or Coggle offer specialized features such as automatic layout, collaboration tools, and integration with other applications. If you are working on a large project or need to collaborate with multiple people, these tools may be a better option. Keep in mind those usually require a subscription to use.
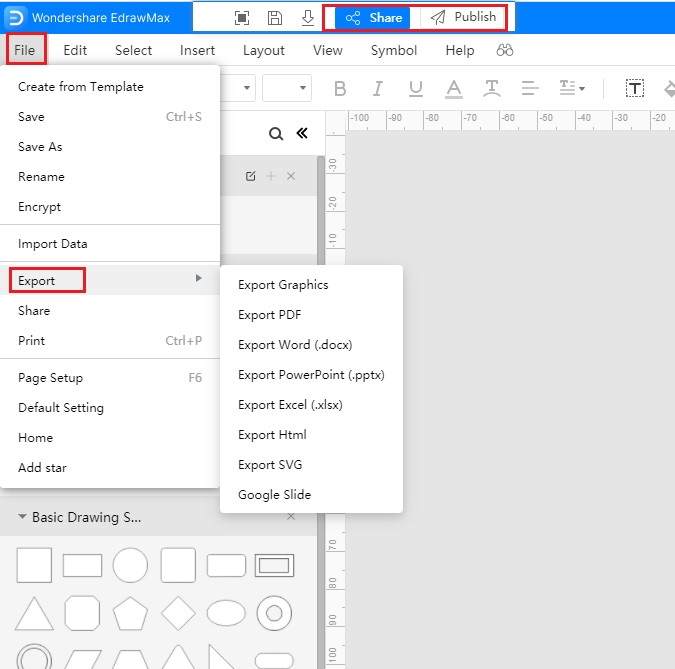
Another alternative is to use Google Drawings directly, as it offers a slightly more robust drawing environment compared to the embedded drawing canvas in Google Docs. You can then insert the Google Drawing into your Google Docs document.
Best Practices for Effective Bubble Maps
A well-designed bubble map should be clear, concise, and easy to understand. Use keywords or short phrases in the bubbles instead of full sentences. This will help to keep the map focused and avoid clutter.
Prioritize the placement of the bubbles to reflect the importance or relationships between the ideas. The most important ideas should be placed closer to the center or in a more prominent position.
Use color and visual cues to guide the viewer's eye and highlight key information. Consistency in formatting is crucial for maintain readability. Remember that the goal is to present complex data in an easy format.
Conclusion
Creating a bubble map in Google Docs is a viable way to visualize and organize information, although it requires some manual effort. By following the steps outlined in this article, you can effectively leverage the drawing tools to create compelling visual representations of your ideas.
While dedicated mind mapping software may offer more advanced features, the Google Docs method provides a convenient option for simple bubble maps within a familiar environment. As Google Docs continues to evolve, it is likely that its drawing capabilities will improve, making it even easier to create visually appealing and informative bubble maps in the future.