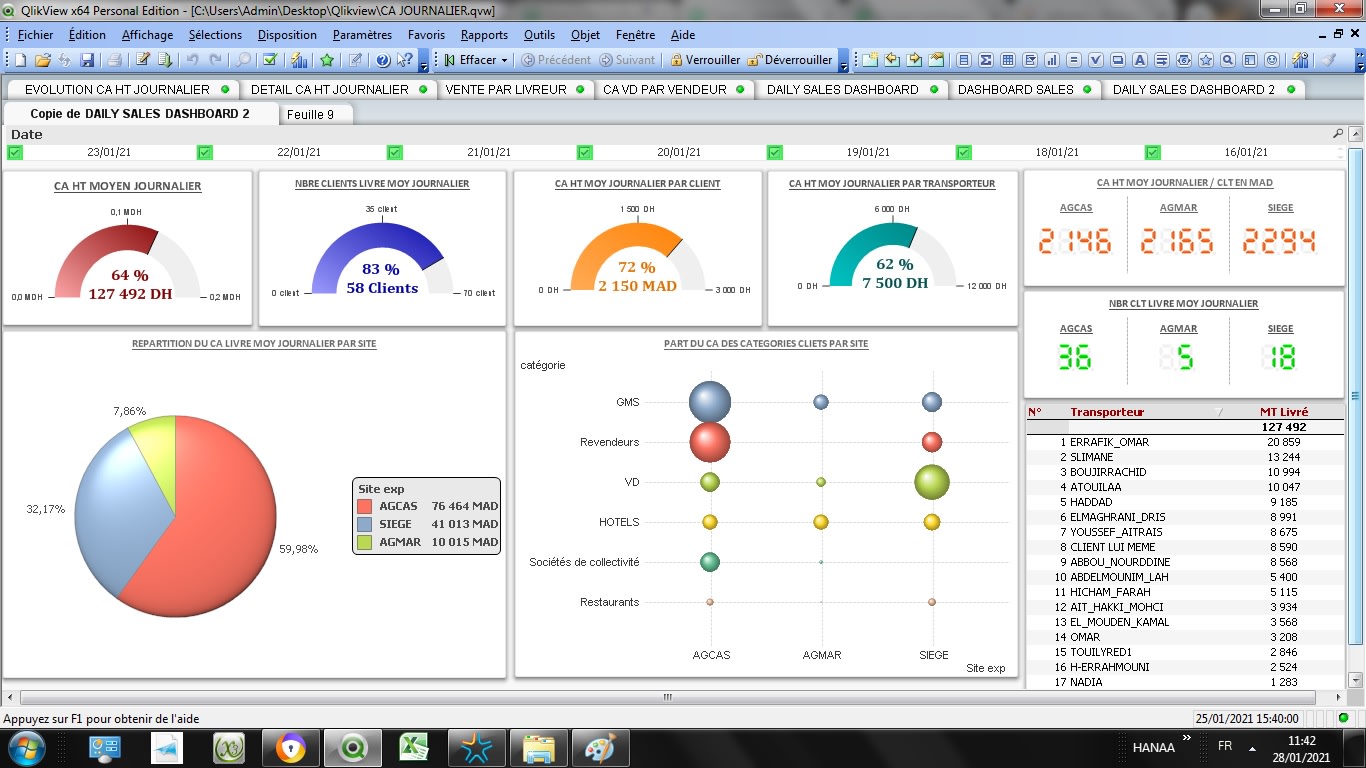
Qlik Sense Sales Dashboard Examples

In today's hyper-competitive business environment, the ability to rapidly interpret and act on sales data is no longer a luxury, but a necessity for survival. Companies are increasingly turning to sophisticated data analytics platforms to gain a competitive edge. Specifically, interactive dashboards showcasing sales performance are becoming crucial tools.
This article delves into the practical applications of Qlik Sense sales dashboards, highlighting real-world examples and functionalities that empower businesses to make data-driven decisions. By examining various use cases and features, it will showcase how Qlik Sense can transform raw sales data into actionable insights, ultimately boosting revenue and improving overall sales strategies. Furthermore, this exploration will consider the benefits, limitations, and future trends associated with implementing these advanced dashboards.
Unlocking Sales Potential with Qlik Sense Dashboards
Qlik Sense stands out as a leading business intelligence (BI) platform known for its associative engine, which enables users to explore data relationships in a non-linear fashion. Its visual analytics capabilities are particularly valuable for creating dynamic sales dashboards tailored to specific needs.
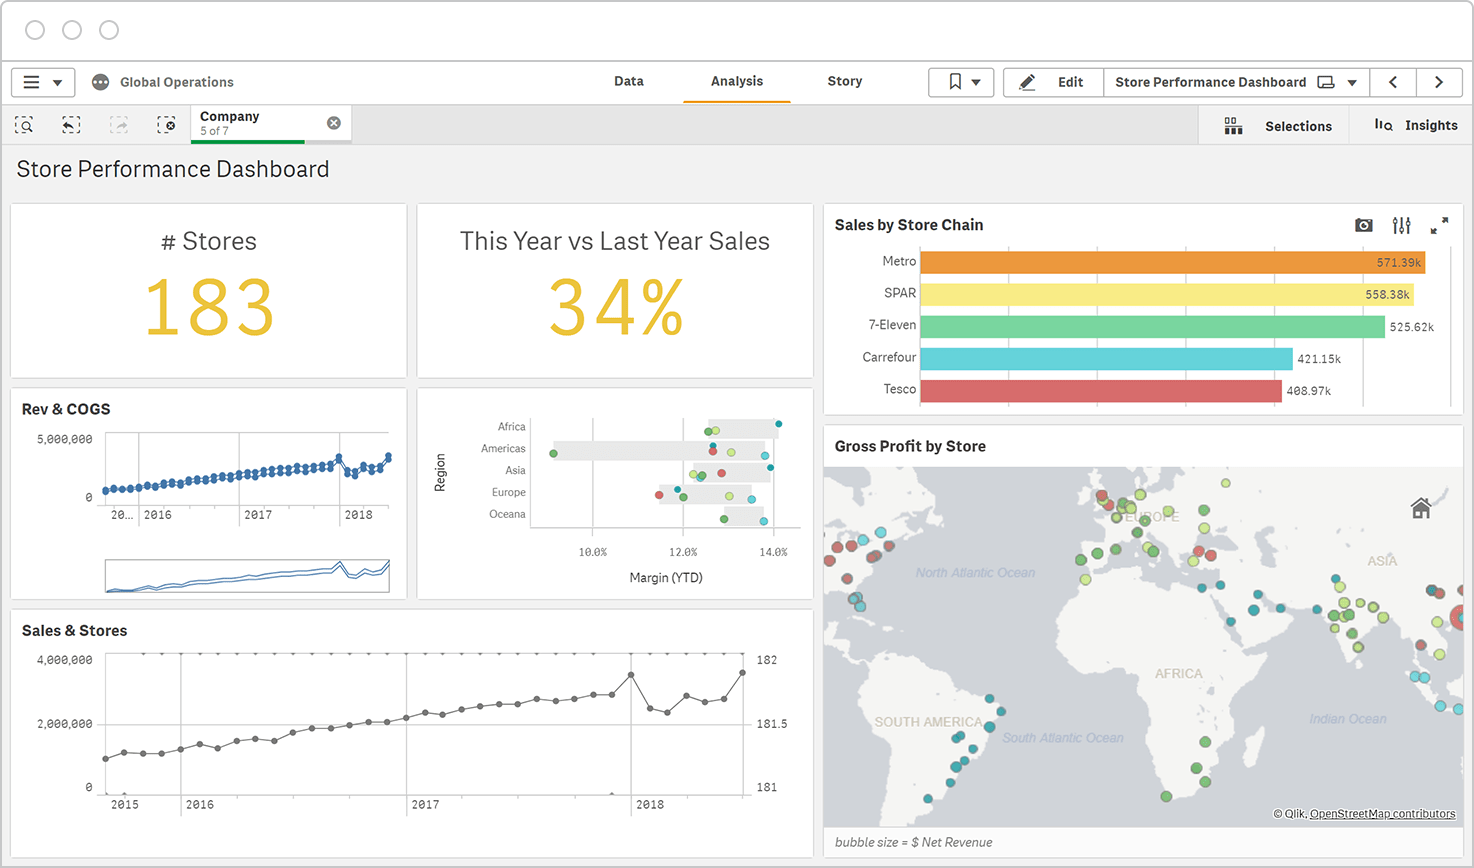
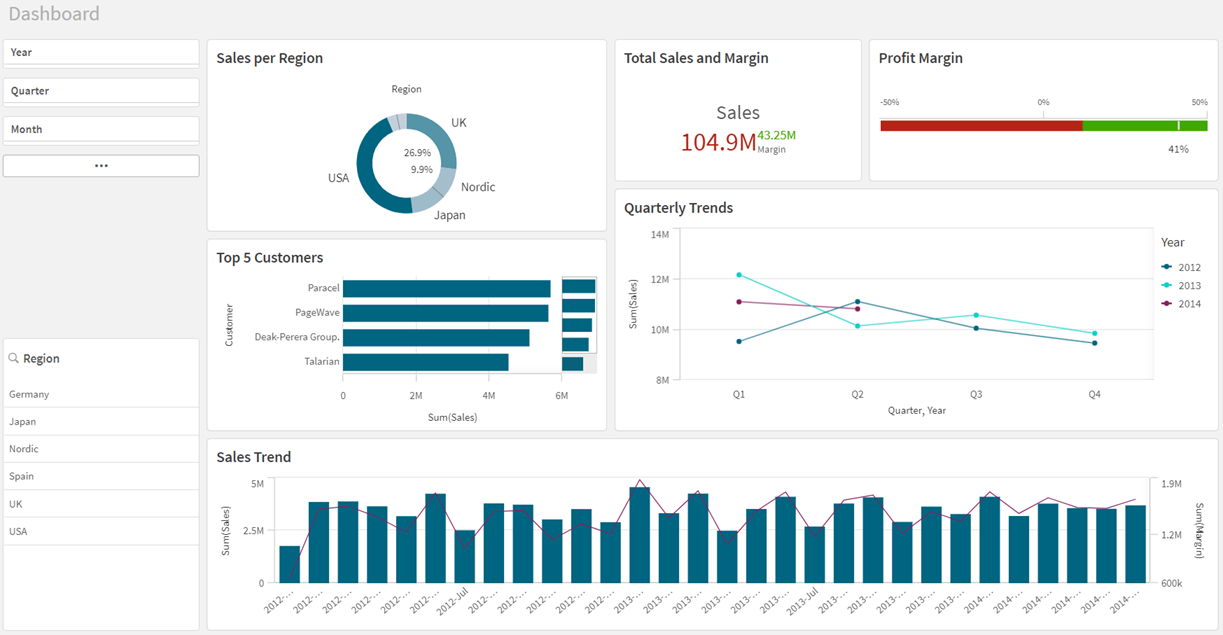
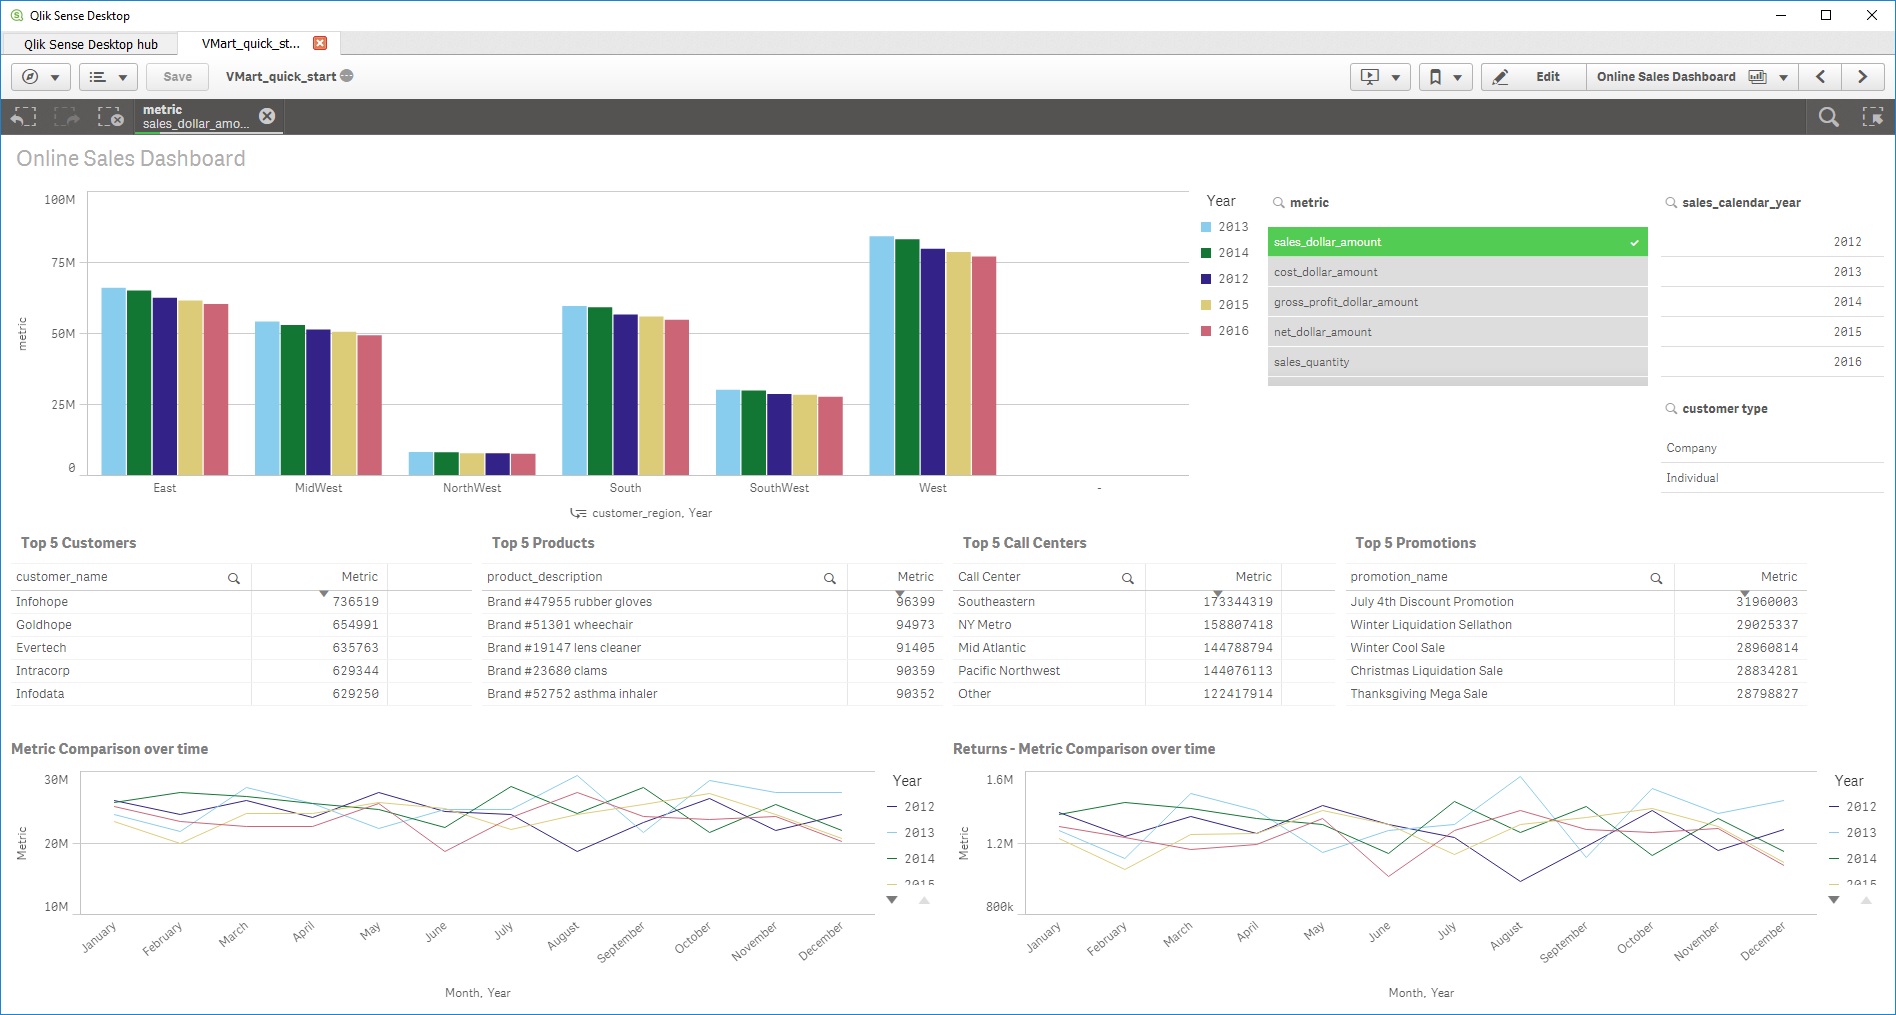
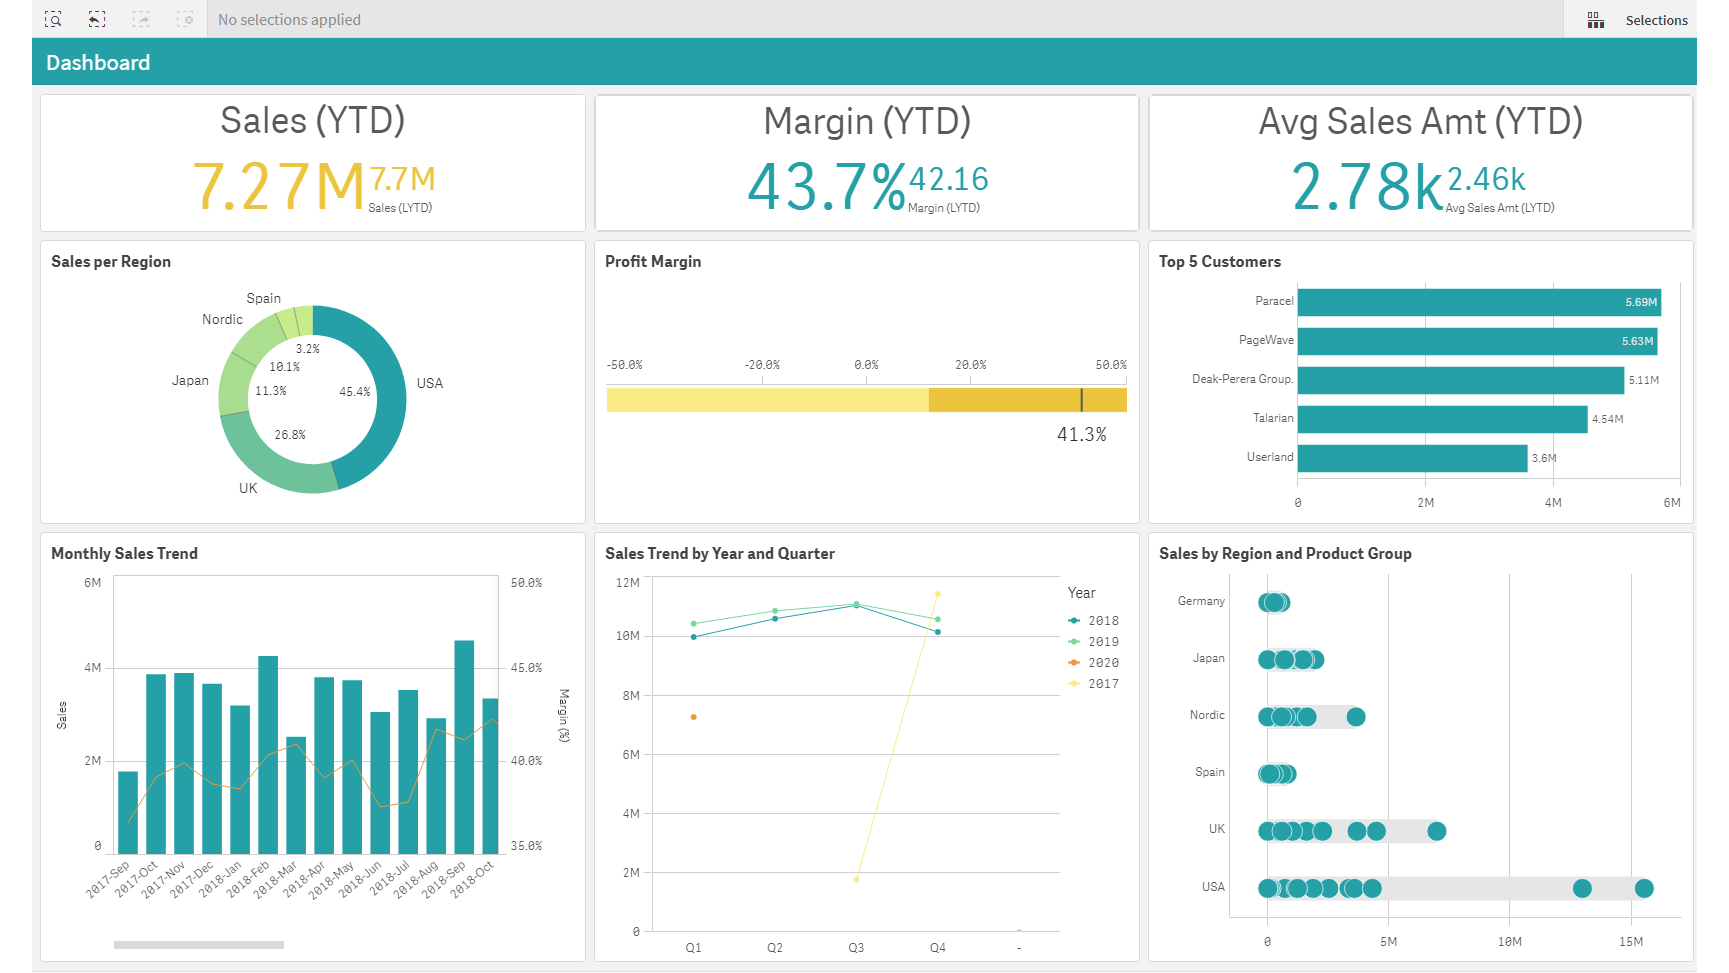
Example 1: Regional Sales Performance Analysis
A common application is the creation of a dashboard focusing on regional sales performance. This dashboard typically visualizes key metrics such as sales revenue, units sold, and average deal size across different geographical regions. Interactive maps, charts, and tables allow sales managers to quickly identify high-performing areas and those that require attention.
For example, a dashboard might reveal that the Western region is exceeding its sales targets due to a successful marketing campaign. Simultaneously, it could highlight that the Eastern region is lagging behind due to increased competition. Such insights enable informed decisions about resource allocation and targeted sales initiatives.
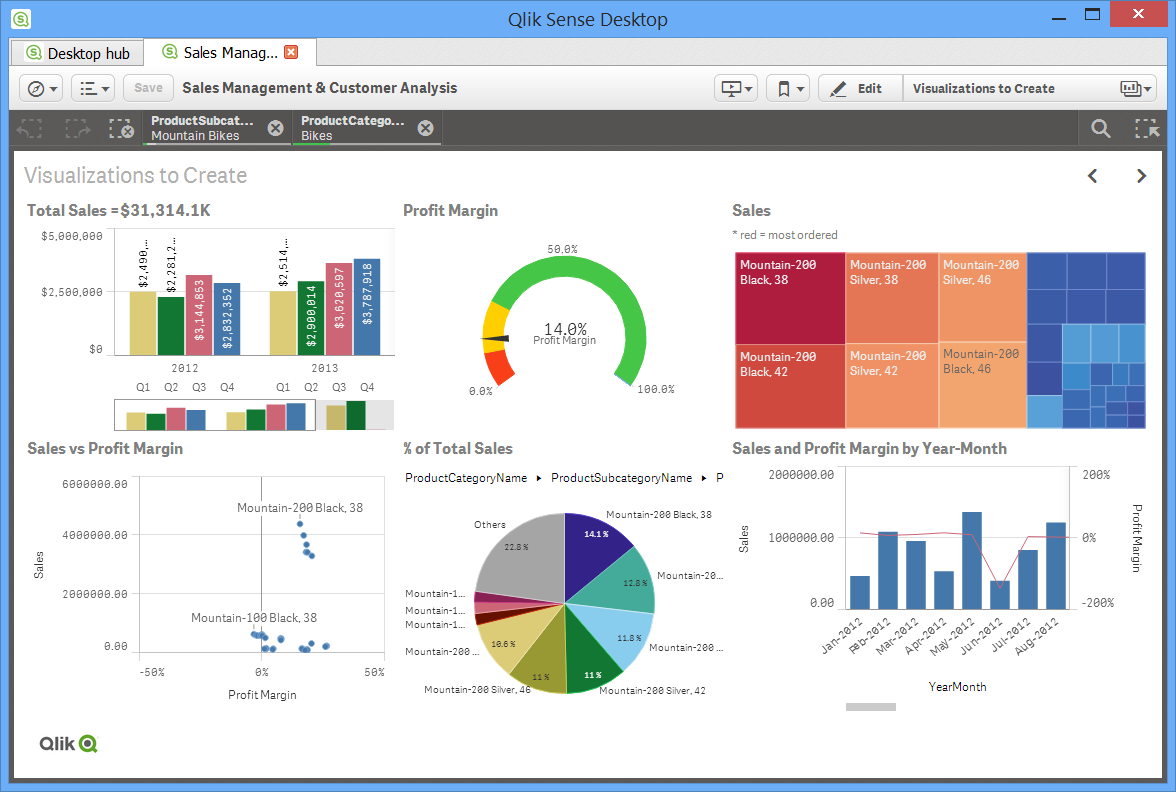
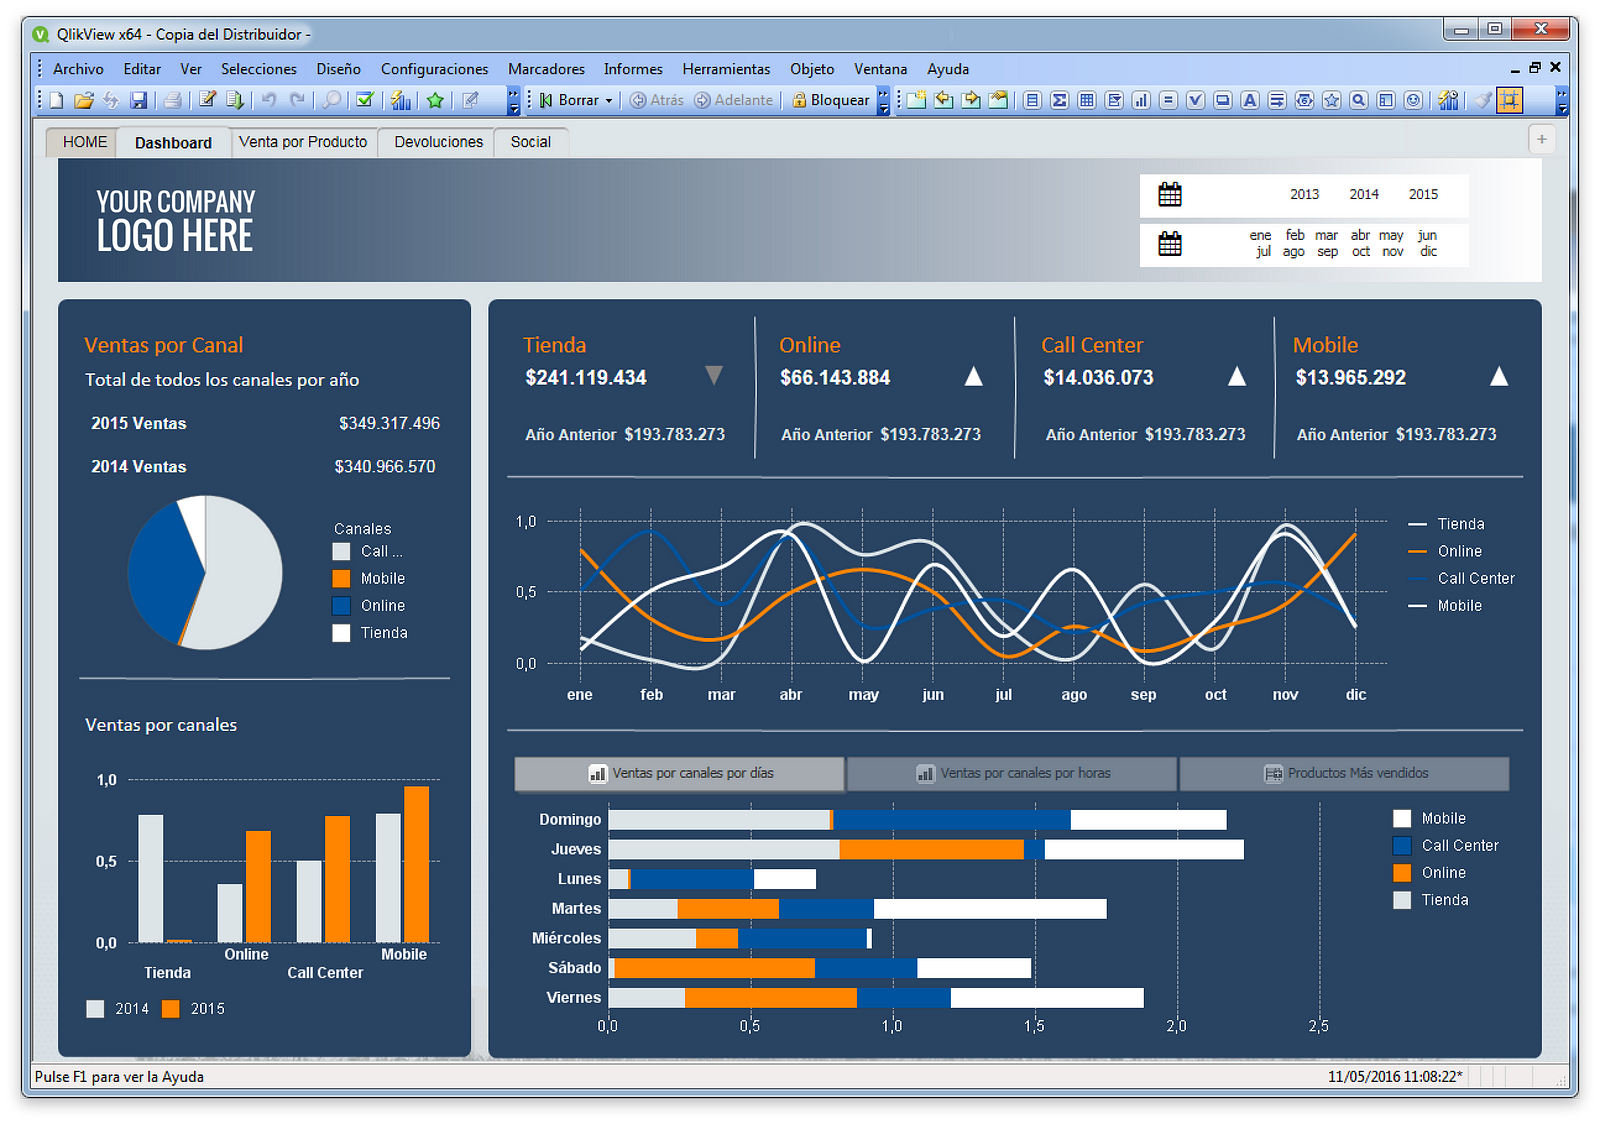
Example 2: Product Sales Analysis
Another crucial application lies in analyzing product sales performance. A Qlik Sense dashboard can track sales revenue, profit margins, and market share for individual products or product categories. This helps businesses understand which products are driving revenue and which ones are underperforming.
This type of dashboard often incorporates features like drill-down analysis, allowing users to examine sales data at a granular level. For instance, it could reveal that a new product launch is failing to gain traction in a specific demographic, prompting a reassessment of the marketing strategy.
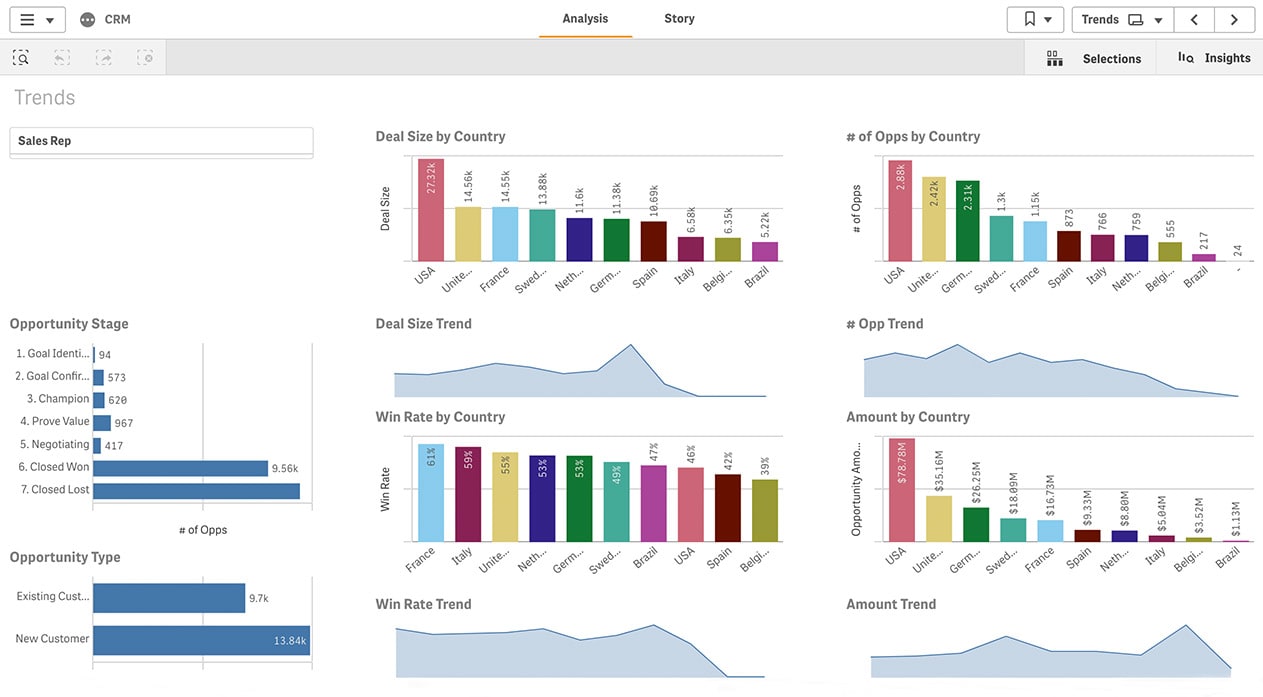
Example 3: Sales Pipeline Management
Effective sales pipeline management is critical for forecasting revenue and closing deals. A Qlik Sense dashboard can visualize the different stages of the sales pipeline, from lead generation to deal closure. This provides sales managers with a clear overview of the pipeline's health and identifies potential bottlenecks.
Dashboards can track key metrics like conversion rates, average sales cycle time, and deal size at each stage. This insight can help pinpoint areas where the sales process can be improved. For example, if the conversion rate from lead to qualified prospect is low, the dashboard might reveal an issue with lead quality or the initial sales pitch.
Key Features and Functionalities
Qlik Sense offers a range of features that enhance the functionality and effectiveness of sales dashboards. Data blending capabilities enable users to combine data from multiple sources, such as CRM systems, ERP systems, and marketing automation platforms. This provides a comprehensive view of the sales process.
Real-time data updates ensure that dashboards are always displaying the most current information. This is crucial for making timely decisions based on the latest sales trends and market conditions. Qlik Sense's associative engine allows users to explore data from different angles and uncover hidden insights.
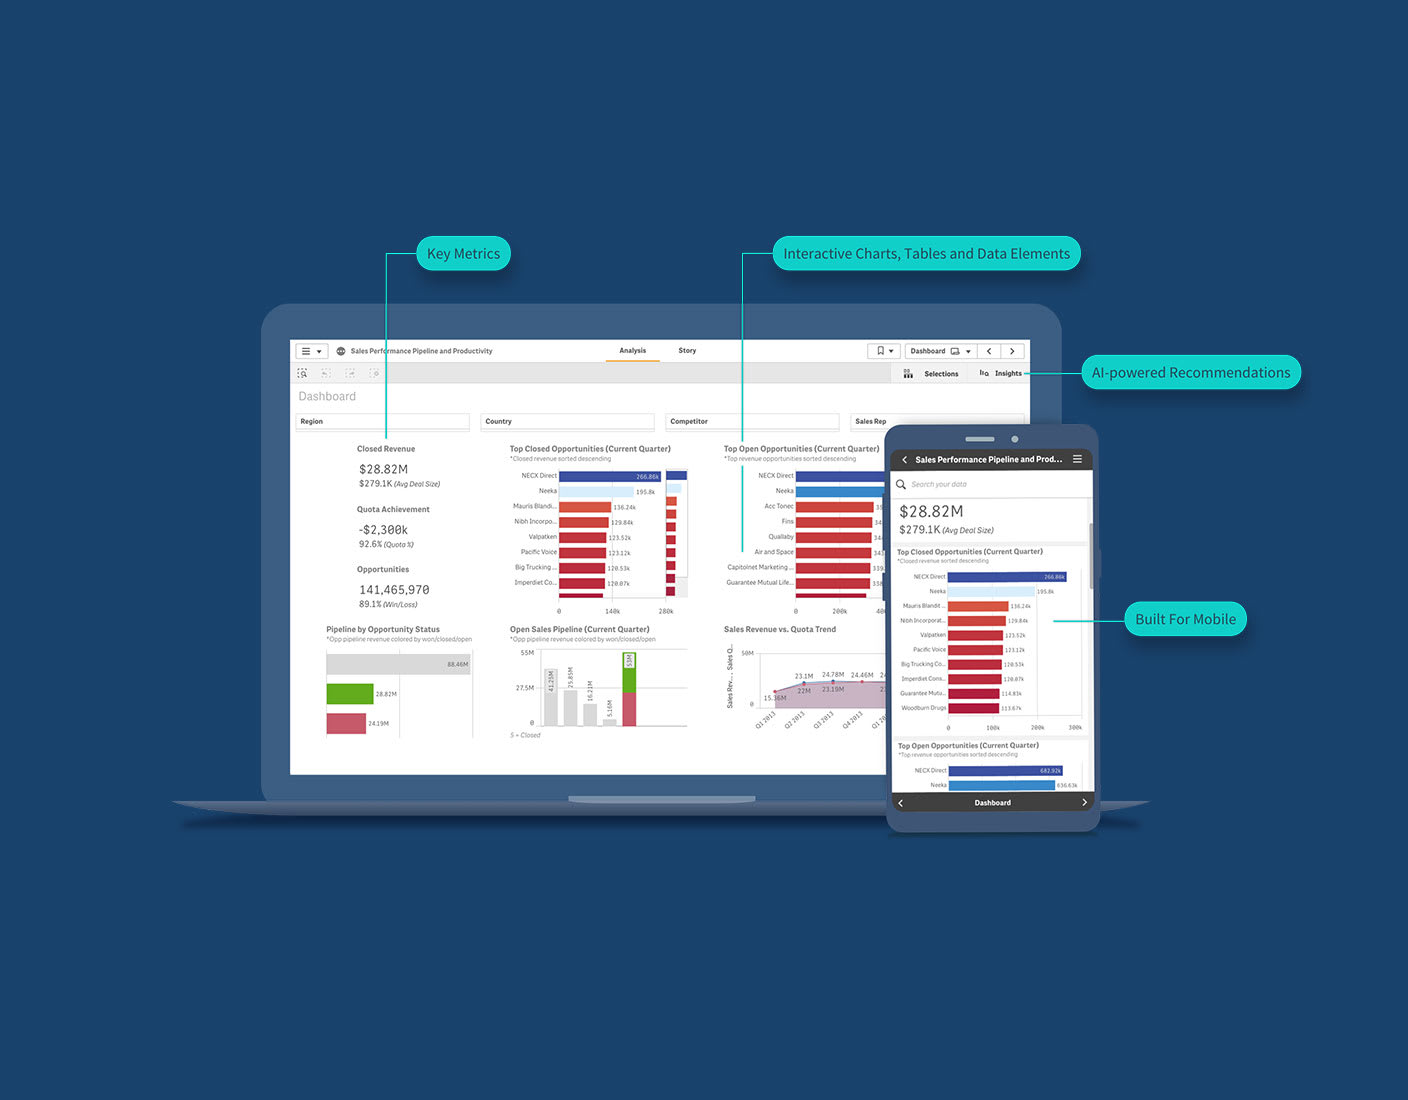
Furthermore, the platform offers mobile accessibility, allowing sales teams to access dashboards on their smartphones and tablets. This ensures that they can stay informed and make decisions on the go.
Challenges and Considerations
While Qlik Sense offers significant benefits, there are also challenges and considerations to be aware of. Data quality is paramount, as inaccurate or incomplete data can lead to misleading insights. Careful data cleansing and validation are essential.
The initial setup and configuration of Qlik Sense dashboards can be complex, requiring expertise in data modeling and visualization. Proper training and support are necessary to ensure that users can effectively utilize the platform. There may be cost considerations associated with purchasing licenses and implementing the software.
The Future of Sales Dashboards
The future of sales dashboards is likely to be shaped by advancements in artificial intelligence (AI) and machine learning (ML). These technologies can automate data analysis, identify patterns, and provide predictive insights. AI-powered dashboards could, for instance, predict which leads are most likely to convert, enabling sales teams to prioritize their efforts.
Furthermore, expect to see increased integration with other business systems, creating a more seamless flow of information across the organization. The demand for self-service analytics will continue to grow, empowering users to create their own dashboards and reports without requiring extensive technical skills.
In conclusion, Qlik Sense sales dashboards are powerful tools that can transform the way businesses analyze and manage their sales data. By providing real-time insights, interactive visualizations, and data blending capabilities, these dashboards empower sales teams to make data-driven decisions and achieve their revenue goals. As technology continues to evolve, the future of sales dashboards will be shaped by AI, machine learning, and increased integration with other business systems, further enhancing their value and impact.