Statistical Significance Depends On Which Of The Following

The concept of statistical significance, a cornerstone of scientific research across various fields, is often misunderstood and its interpretation is not always straightforward. While a statistically significant result suggests that an observed effect is unlikely to have occurred by chance, its determination relies on several crucial factors.
Understanding these factors is vital for researchers, policymakers, and the general public to accurately assess the validity and relevance of research findings.
The Significance of Significance
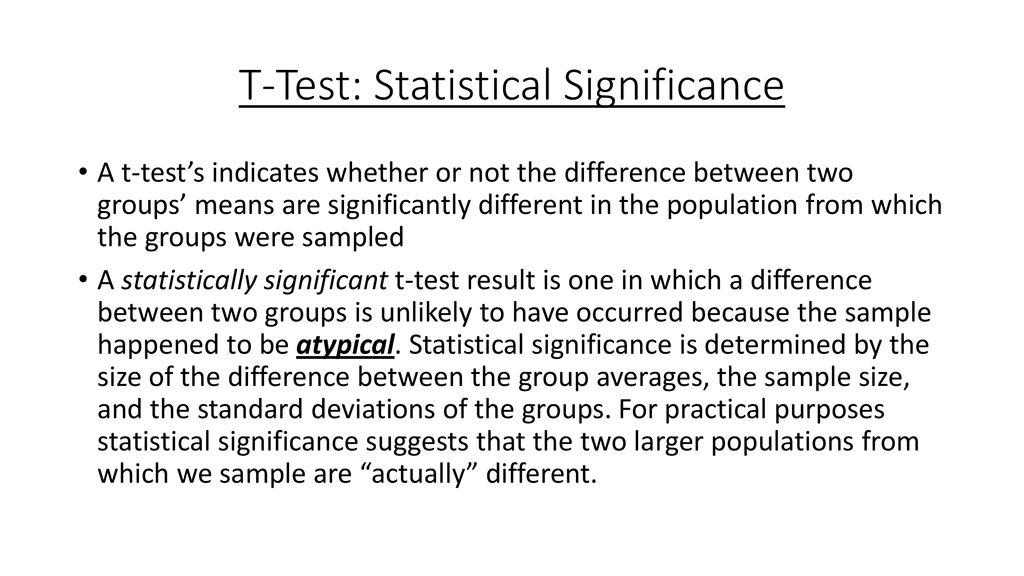
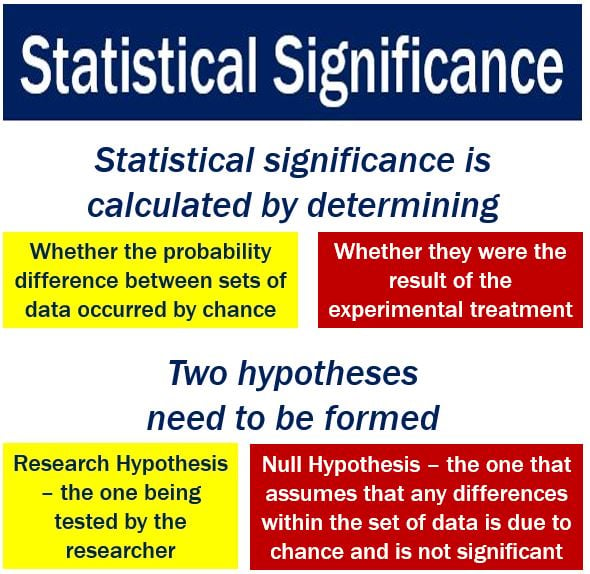
Statistical significance, at its core, helps researchers differentiate real effects from random noise in data. It’s used to determine whether the observed difference between groups, or the relationship between variables, is likely a genuine finding or simply a result of sampling variability.
However, statistical significance is not an intrinsic property of the data itself. It is a judgment call based on several key components.
The Alpha Level (Significance Level)
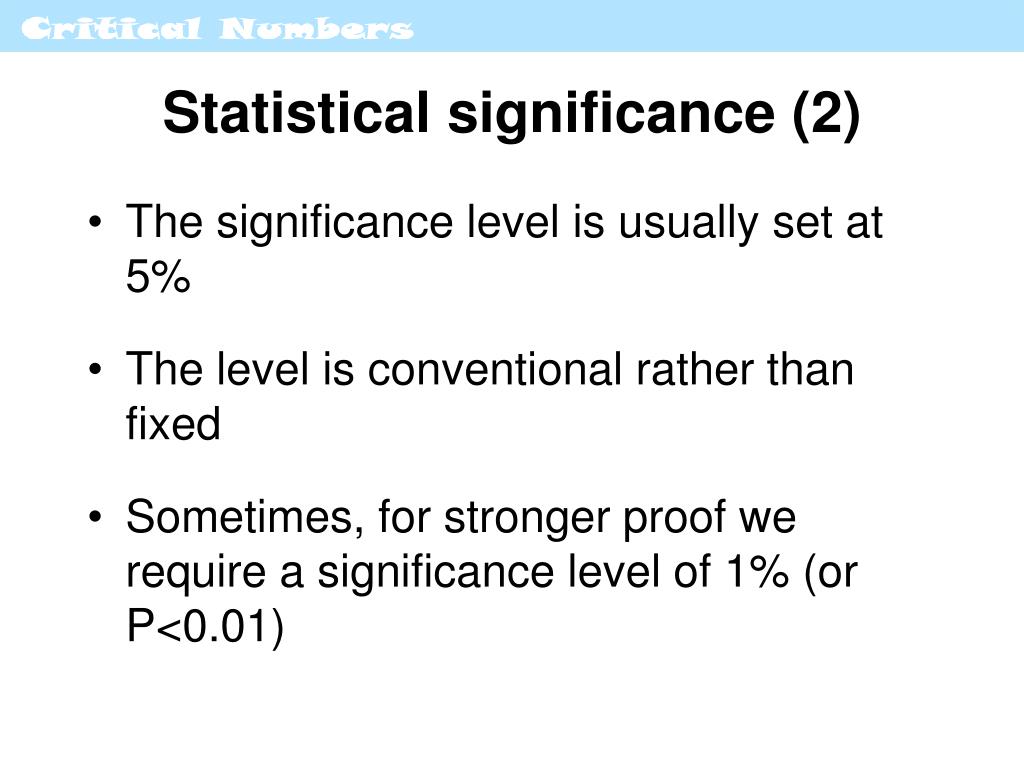
The alpha level, often denoted as α, represents the probability of rejecting the null hypothesis when it is actually true. In simpler terms, it's the risk a researcher is willing to take of concluding there is an effect when there isn't one (a false positive).
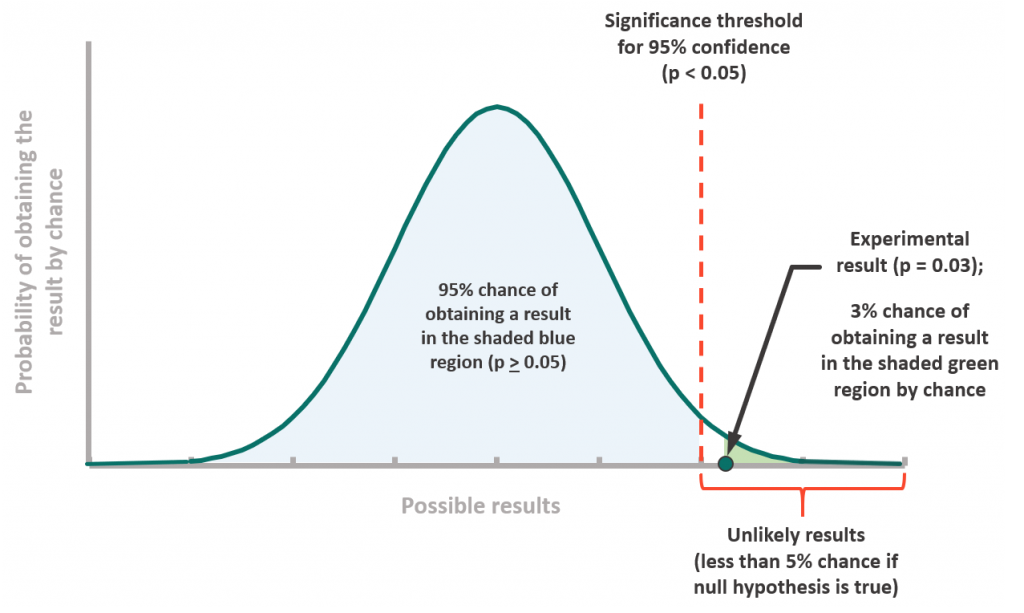
The most commonly used alpha level is 0.05, meaning there is a 5% chance of incorrectly rejecting the null hypothesis. A lower alpha level (e.g., 0.01) makes it harder to reject the null hypothesis, reducing the risk of a false positive but increasing the risk of a false negative (failing to detect a real effect).
Choosing the appropriate alpha level depends on the context of the research and the potential consequences of making a wrong decision.
Sample Size
The sample size is the number of observations included in a study. A larger sample size generally provides more statistical power, which is the probability of detecting a true effect when it exists.
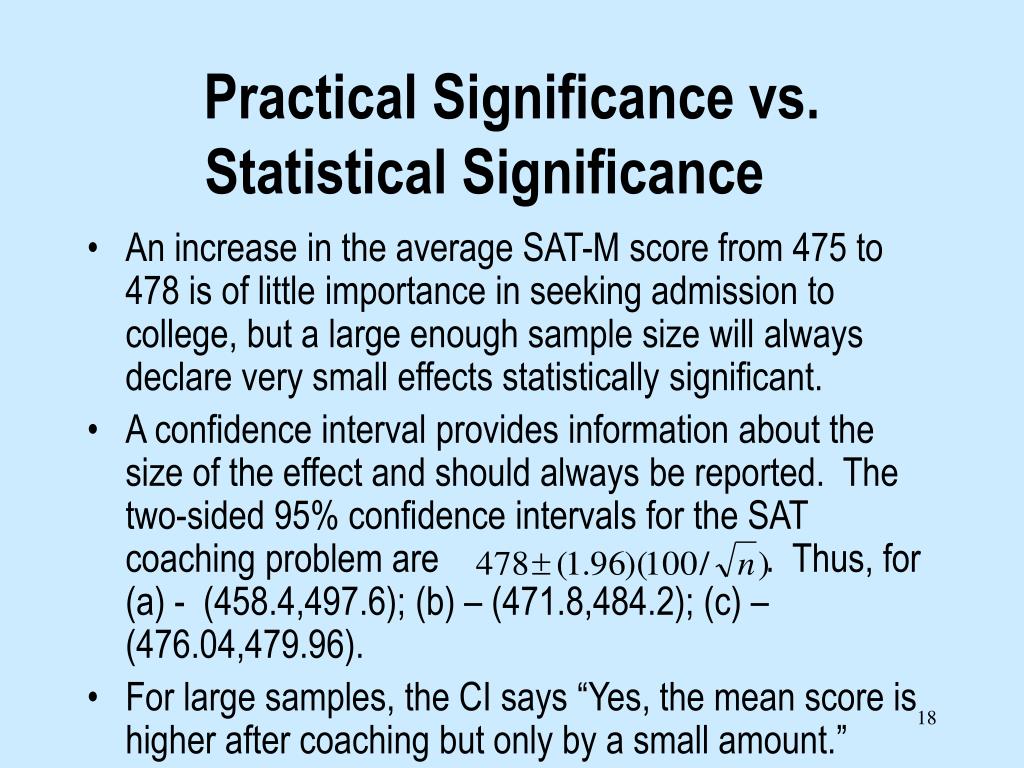
With a small sample size, even a substantial effect might not reach statistical significance due to high variability. Conversely, a very large sample size can make even tiny, practically unimportant effects statistically significant.
Therefore, it's crucial to consider the sample size when interpreting statistical significance.
Effect Size
The effect size measures the magnitude of the observed effect. It quantifies the practical importance or relevance of a finding, independent of sample size.
A statistically significant result with a small effect size might not be meaningful in the real world. For instance, a drug might produce a statistically significant but very small improvement in patient outcomes, making it clinically irrelevant.
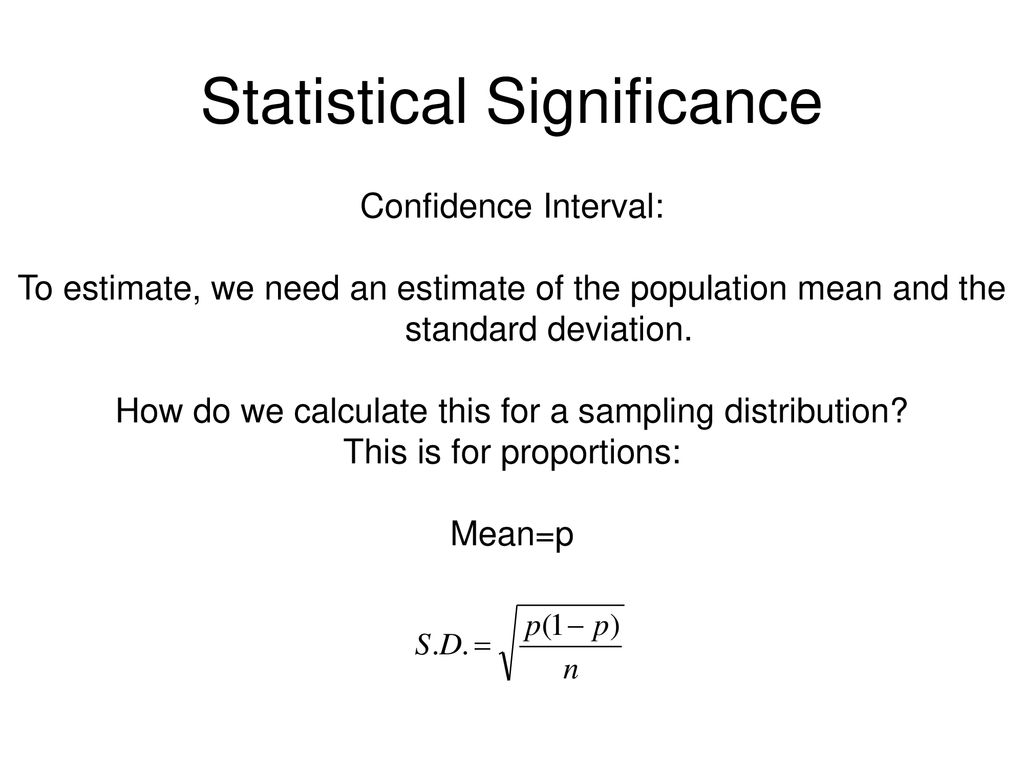
Common measures of effect size include Cohen's d for comparing means and correlation coefficients for assessing relationships between variables.
Variability of the Data
The variability or spread of the data also influences statistical significance. Higher variability, or greater variance, makes it more difficult to detect significant differences or relationships.
Reducing variability through careful experimental design or by using statistical techniques can increase the likelihood of obtaining statistically significant results.
Understanding and addressing sources of variability is critical for robust research.
One-Tailed vs. Two-Tailed Tests
The choice between a one-tailed and a two-tailed hypothesis test also affects statistical significance. A two-tailed test examines whether the effect exists in either direction, while a one-tailed test focuses on whether the effect exists in a specific direction.
One-tailed tests are more powerful than two-tailed tests if the researcher is certain about the direction of the effect. However, using a one-tailed test when the direction of the effect is uncertain increases the risk of missing an effect in the opposite direction.
Researchers should justify their choice of one-tailed or two-tailed tests before conducting the analysis.
The Null Hypothesis
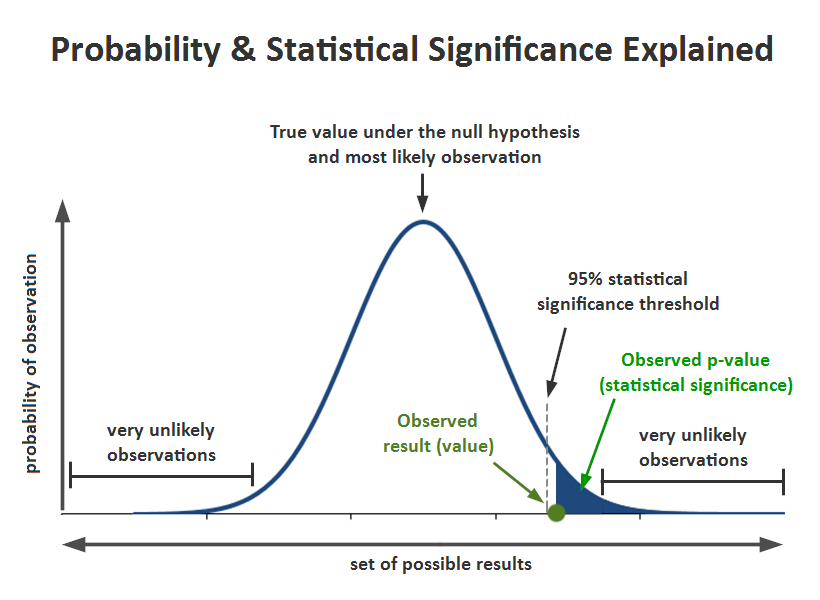
The null hypothesis is a statement that there is no effect or no difference between groups. Statistical significance is determined by evaluating the evidence against the null hypothesis.
Failing to reject the null hypothesis does not necessarily mean the null hypothesis is true; it simply means that there is not enough evidence to reject it. The absence of evidence is not evidence of absence.
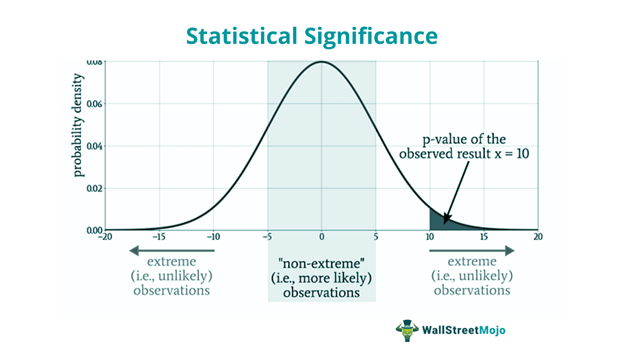
The strength of the evidence against the null hypothesis is measured by the p-value, which represents the probability of observing the data (or more extreme data) if the null hypothesis were true.
Interpreting Statistical Significance Responsibly
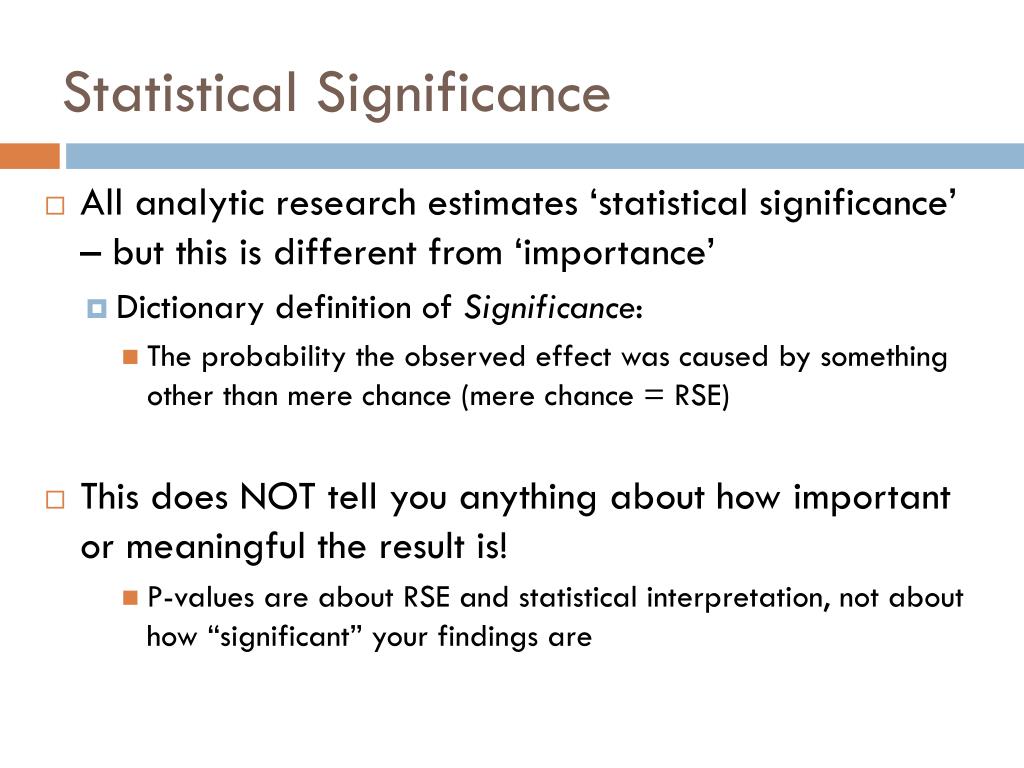
While statistical significance provides valuable information about the likelihood of an effect being genuine, it's important to avoid over-reliance on p-values and consider other factors. Focusing solely on statistical significance can lead to p-hacking, where researchers manipulate their data or analyses to achieve statistically significant results.
The American Statistical Association (ASA) has issued statements cautioning against the overuse and misinterpretation of p-values. The ASA emphasizes the importance of considering effect sizes, confidence intervals, and the context of the research when interpreting results.
Ultimately, statistical significance should be viewed as one piece of the puzzle, along with other evidence and expert judgment, when making informed decisions.
By understanding the various factors that influence statistical significance, researchers and consumers of research can make more informed judgments about the validity and relevance of scientific findings, leading to better policies and outcomes.
