The Price Earnings Ratio Is Calculated By Dividing
In the complex world of finance, where fortunes are made and lost on the flutter of market sentiments, one metric quietly underpins many investment decisions: the Price-Earnings (P/E) ratio. A seemingly simple calculation, it can be a powerful tool, or a dangerously misleading indicator, depending on how it's understood and applied.
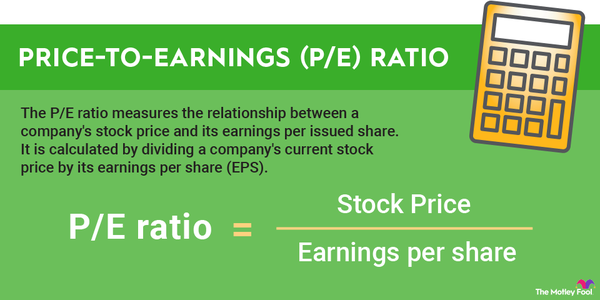
This article delves into the intricacies of the Price-Earnings ratio – calculated by dividing a company's stock price by its earnings per share (EPS) – exploring its strengths, limitations, and the crucial role it plays in investment analysis. We will examine how investors use it to assess value, compare companies, and predict future performance, while also highlighting the pitfalls of relying solely on this single metric. The aim is to provide a comprehensive understanding of the P/E ratio, empowering readers to navigate the complexities of financial analysis with greater confidence.
Understanding the Calculation and Interpretation
At its core, the P/E ratio offers a snapshot of how much investors are willing to pay for each dollar of a company's earnings. A high P/E ratio typically suggests that investors anticipate strong future earnings growth. Conversely, a low P/E ratio might indicate that a company is undervalued, or that investors have concerns about its future prospects.
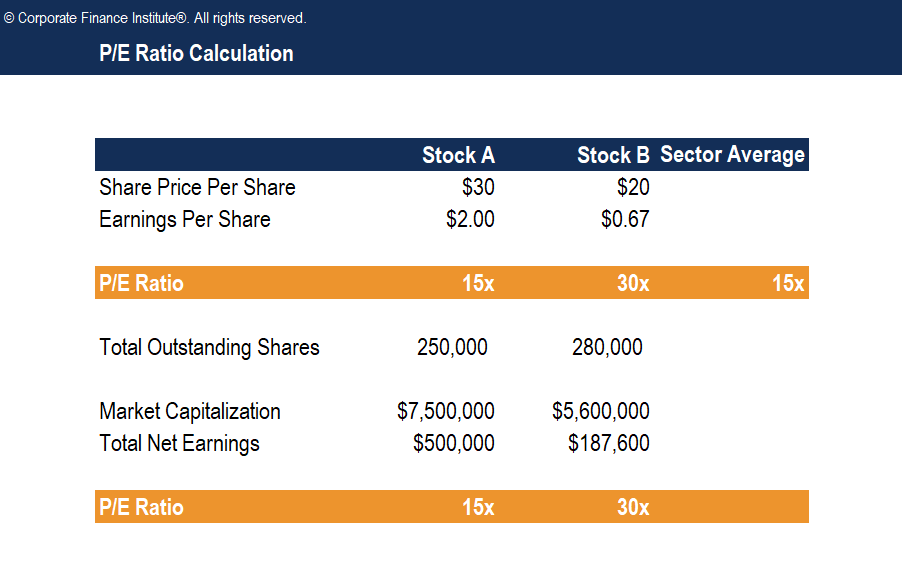
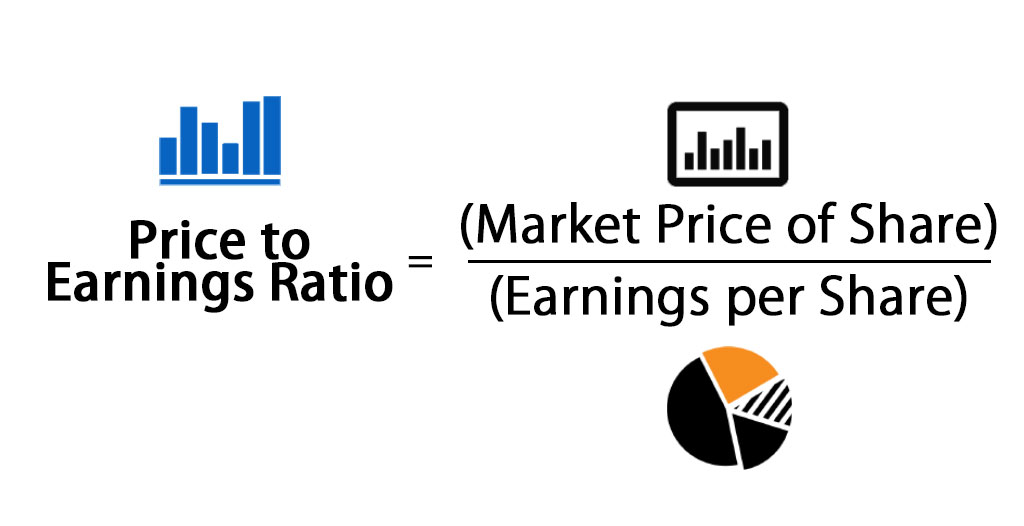
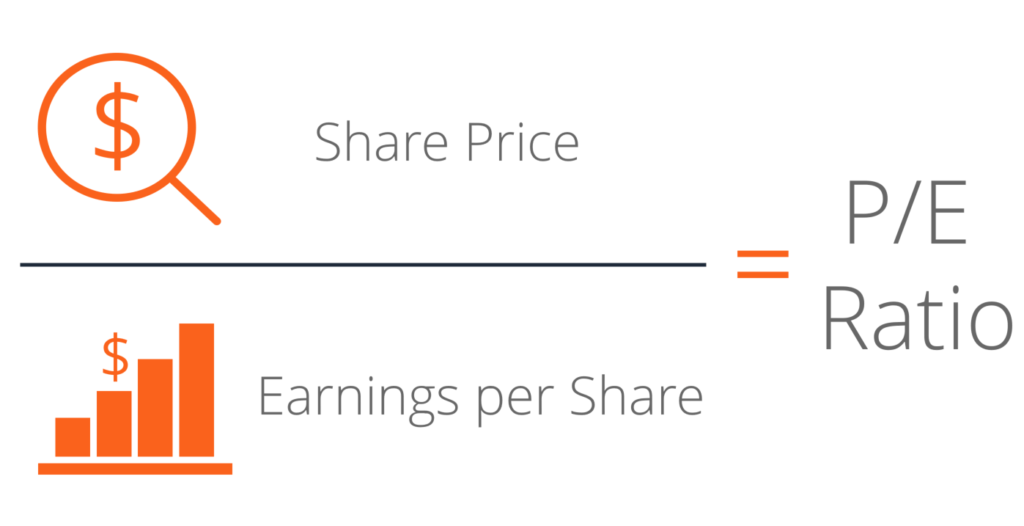
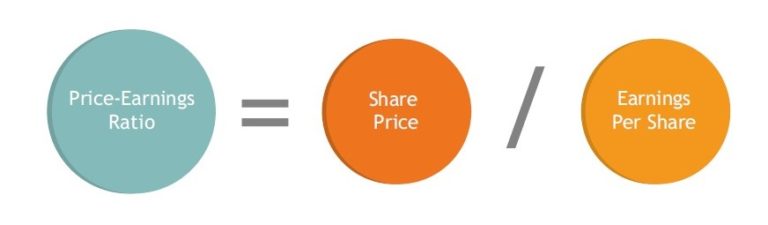
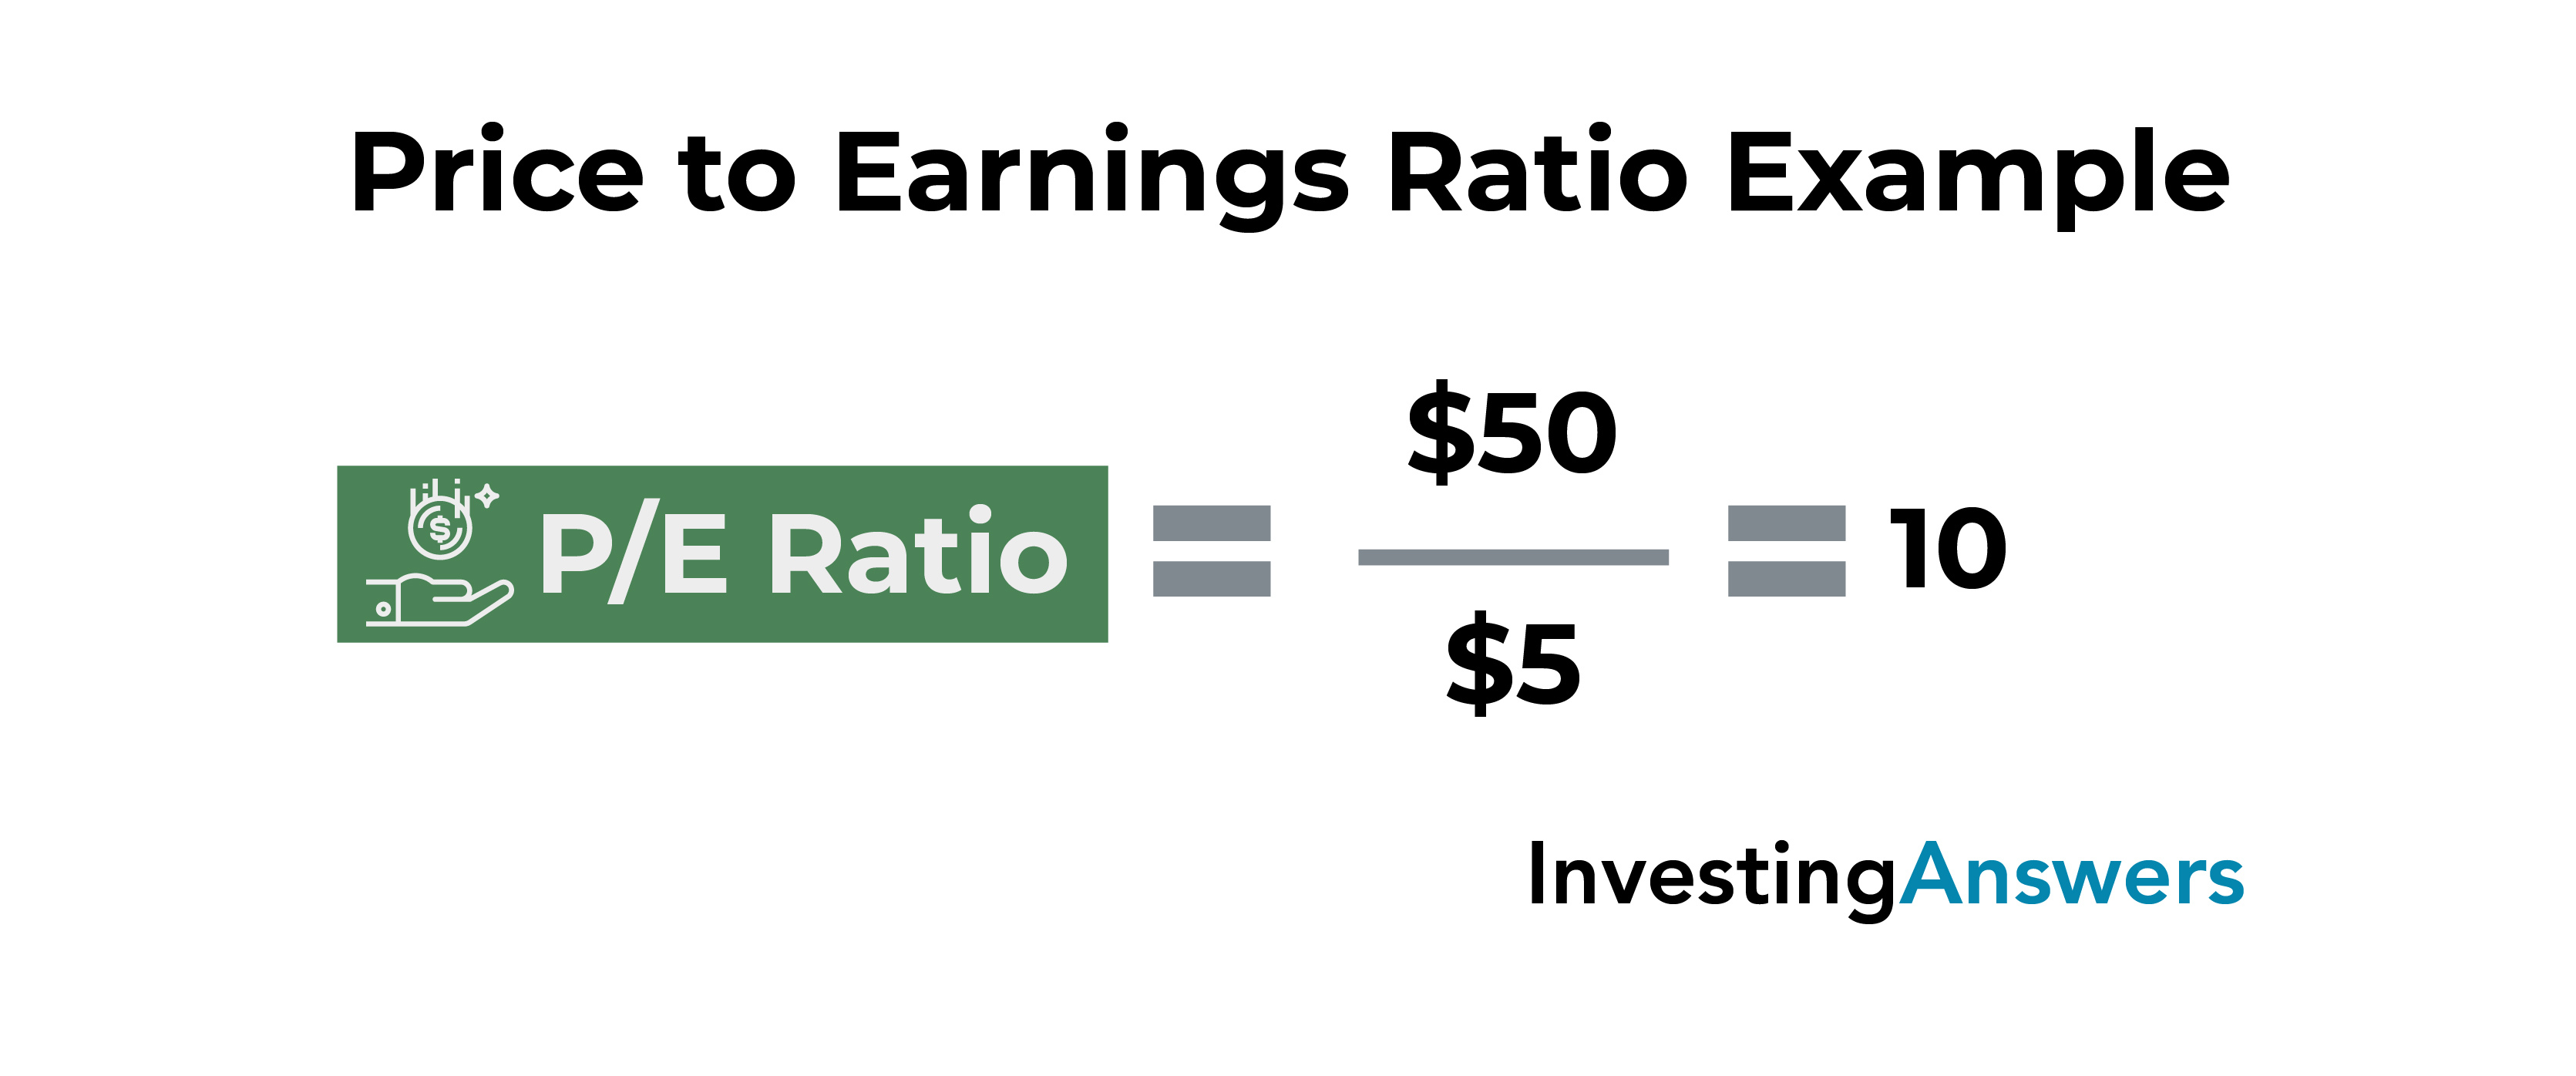
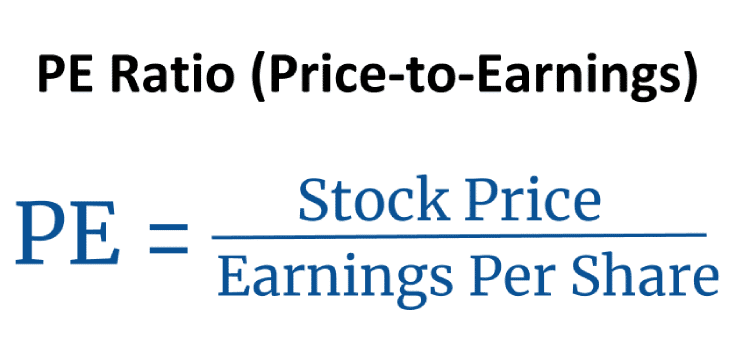
The formula is straightforward: P/E Ratio = Market Value per Share / Earnings per Share (EPS). EPS, in turn, is calculated by dividing a company's net income by the number of outstanding shares.
Several variations of the P/E ratio exist. The trailing P/E ratio uses past earnings, while the forward P/E ratio uses projected future earnings. Understanding the distinction is critical, as projections can be overly optimistic or pessimistic, impacting the ratio’s reliability.
The P/E Ratio as a Valuation Tool
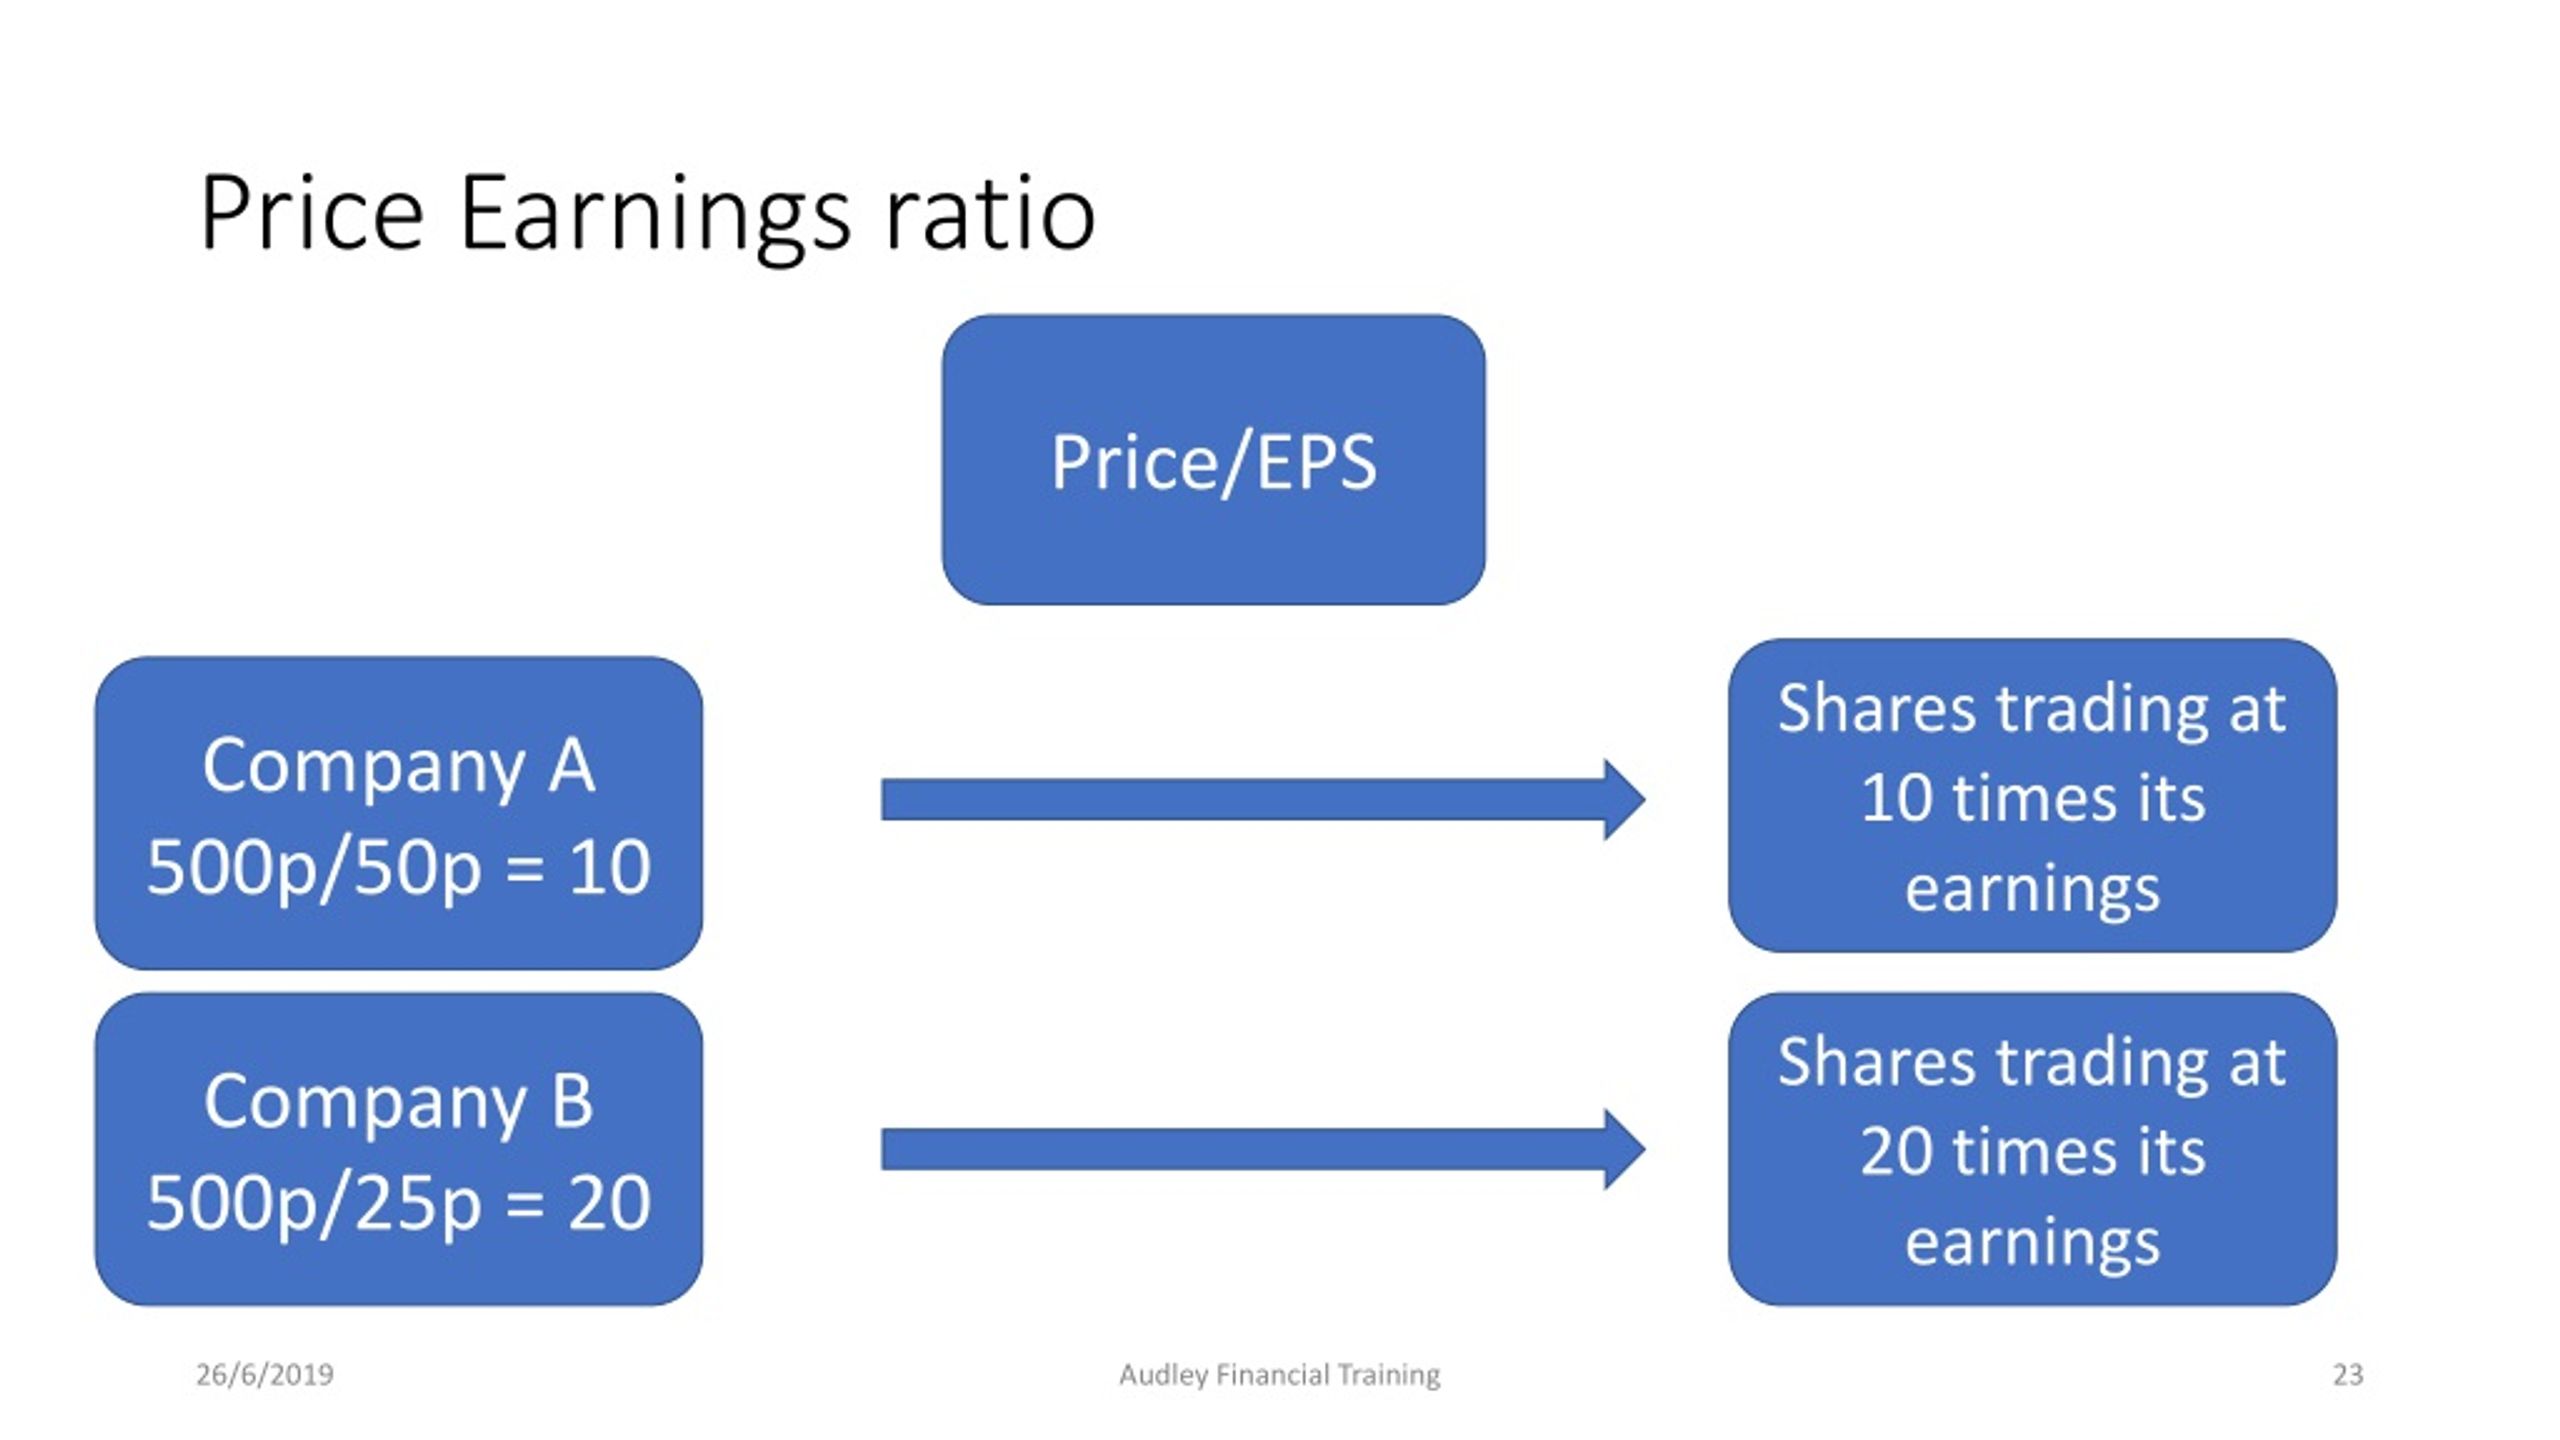
Investors use the P/E ratio to compare the relative valuations of different companies within the same industry. If Company A has a P/E of 20 and Company B has a P/E of 10, investors might consider Company B to be relatively undervalued.
However, this is a simplistic view. The P/E ratio must be considered alongside other factors such as growth rate, debt levels, and industry dynamics.
Furthermore, the average P/E ratio for an entire market (e.g., the S&P 500) can serve as a benchmark for assessing whether the market as a whole is overvalued or undervalued. Historical data from sources like Professor Robert Shiller's work on cyclically adjusted price-to-earnings (CAPE) ratio provides valuable context.
Limitations and Potential Pitfalls
One of the major limitations of the P/E ratio is its reliance on earnings, which can be manipulated through accounting practices. Companies can use various accounting techniques to inflate their earnings, making their P/E ratios appear more attractive than they actually are.
Companies with negative earnings cannot have a P/E ratio. This makes it difficult to compare unprofitable companies with profitable ones using this metric alone.
The P/E ratio is also highly sensitive to cyclical industries. Companies in industries that are heavily influenced by economic cycles may experience significant fluctuations in earnings, leading to volatile P/E ratios that are difficult to interpret. This is why context matters.
Industry-Specific Considerations
Different industries naturally command different P/E ratios. High-growth sectors like technology typically have higher P/E ratios than mature industries like utilities.
This is because investors are willing to pay a premium for companies that are expected to grow rapidly. Comparing P/E ratios across different industries without considering these fundamental differences can be misleading.
Furthermore, intangible assets like brand reputation and intellectual property, which are increasingly important in today's economy, are not always reflected in a company's earnings, potentially distorting the P/E ratio as an indicator of value. Think of companies like Apple or Google.
Alternative Metrics and a Holistic Approach
Given the limitations of the P/E ratio, investors often use it in conjunction with other valuation metrics. These may include the Price-to-Book (P/B) ratio, Price-to-Sales (P/S) ratio, and the Discounted Cash Flow (DCF) analysis.
The P/B ratio compares a company's market value to its book value, providing a measure of how much investors are willing to pay for each dollar of net assets. The P/S ratio compares a company's market value to its revenue, which can be useful for valuing companies that are not yet profitable.
DCF analysis involves projecting a company's future cash flows and discounting them back to their present value. Taking a holistic approach to valuation, considering multiple metrics, provides a more robust assessment of a company's true worth.
The Future of P/E Ratio Analysis
While the P/E ratio remains a widely used valuation metric, its role is evolving in the face of increasing market complexity. The rise of algorithmic trading and quantitative investing has led to more sophisticated approaches to valuation that incorporate a wider range of data points.
Technological advancements, such as artificial intelligence and machine learning, are being used to analyze vast amounts of financial data and identify patterns that are not readily apparent to human analysts.
Despite these advancements, the fundamental principles of valuation remain important. Investors who understand the strengths and limitations of the P/E ratio, and who use it in conjunction with other metrics, will be better equipped to make informed investment decisions. As Warren Buffett often emphasizes, understanding the underlying business is key.


+ratio+is+a+measure+of+investors’+confidence+in+a+company’s+future..jpg)


.jpg)