How To Find Residual Plot On Ti-84

Ever feel like your calculator is hiding secrets from you? Well, buckle up, because you're about to unlock one! We're diving into the world of residual plots on your trusty TI-84. Get ready for a wild ride!
First Things First: The Data Entry Fiesta!
Fire up your TI-84. Let’s get some data into those lists. Think of it like preparing ingredients for a delicious mathematical recipe.
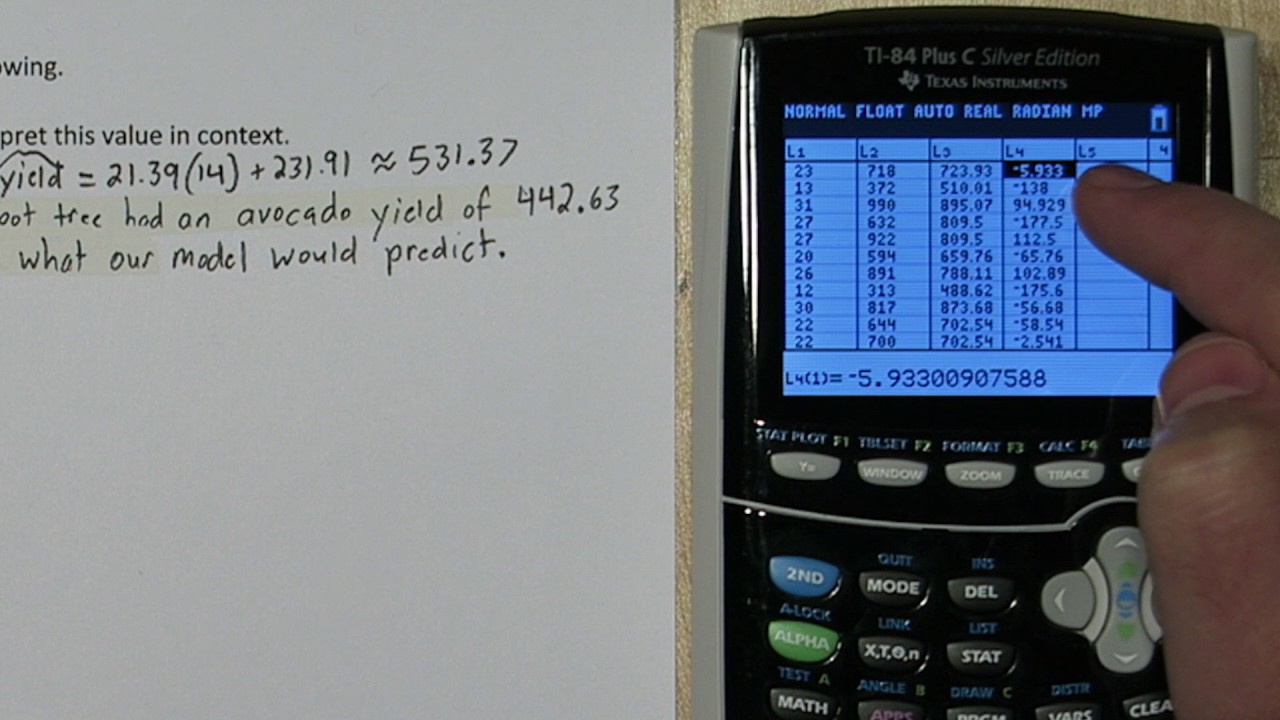
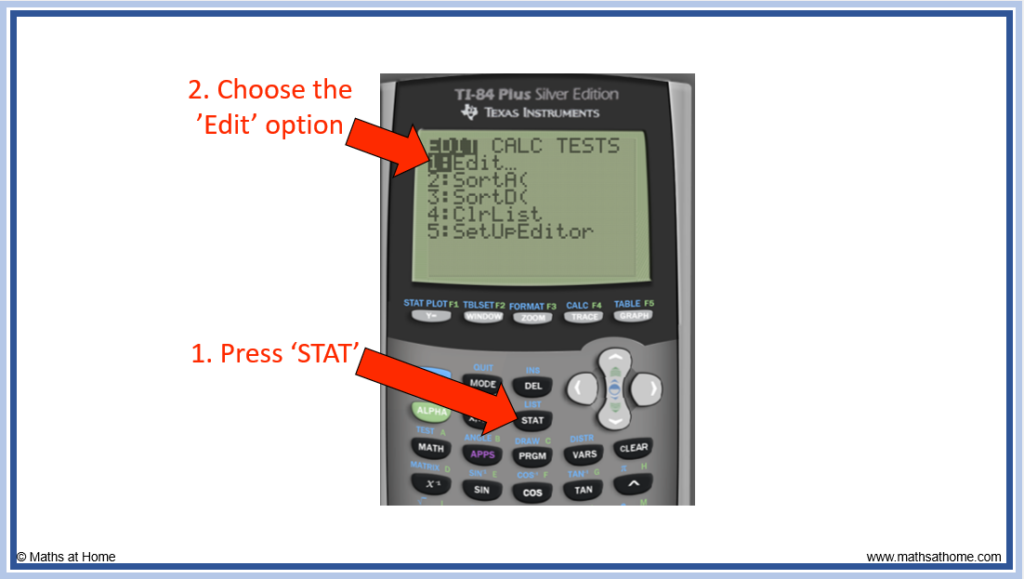
Hit the "STAT" button. Then, select "EDIT." Now, pop your x-values into L1 and your y-values into L2. It's like creating a playlist for your calculator!
Regression Revelation!
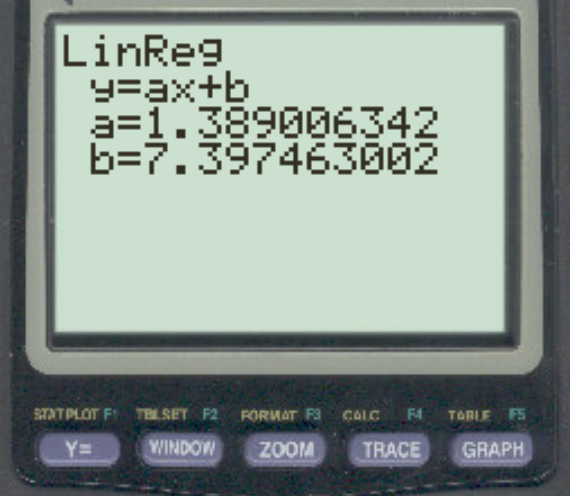
Ready to unleash the power of regression? Press "STAT" again. Then, navigate over to "CALC." Choose your regression type. Linear? Quadratic? The choice is yours!
Tell the calculator where your data lives. Specify L1 as your Xlist and L2 as your Ylist. Don't forget to store your regression equation! This is where the magic truly begins.
Type "VARS", then select "Y-VARS", and then "Function". Finally, choose Y1. This tells the calculator to save the line of best fit for later viewing.
Plotting Party Time!
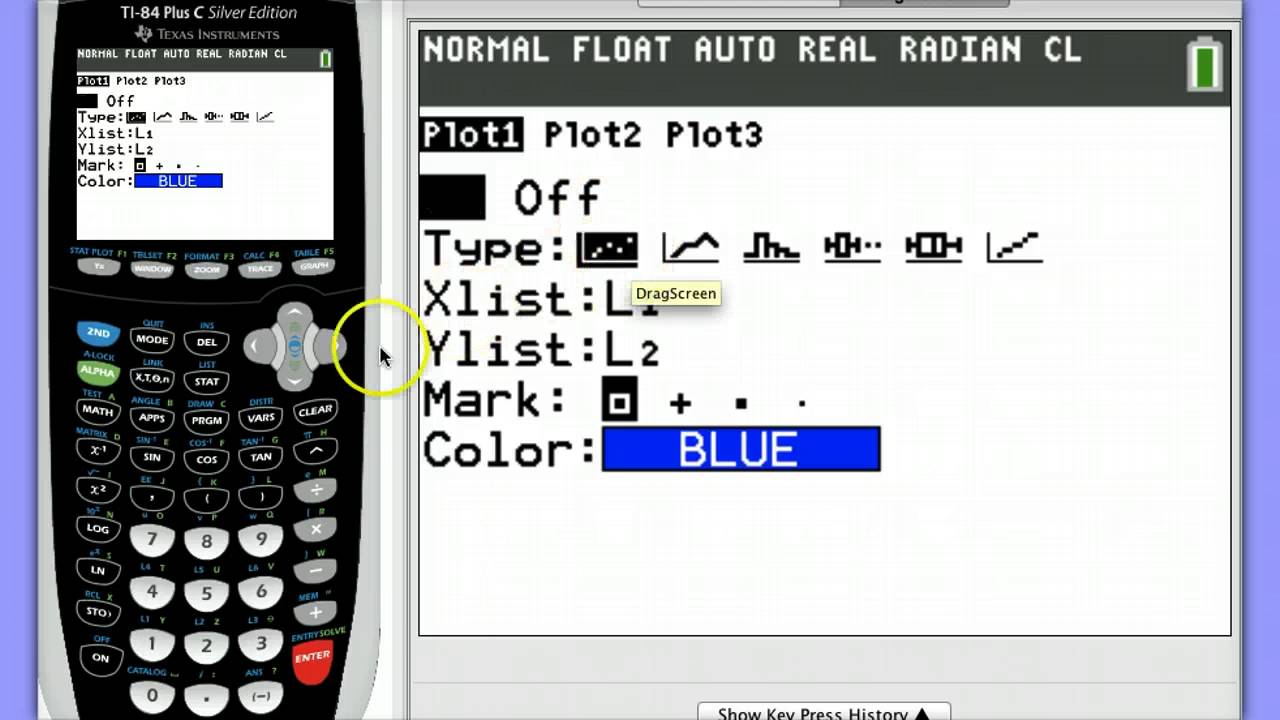
This is where things get interesting. Time to turn on your scatter plot. Hit "2nd" and then "Y=". You'll see STAT PLOT.
Select Plot1. Turn it "On,". Choose the scatter plot icon. Confirm that your Xlist is L1 and your Ylist is L2. Now, we are ready to visualize the data!
Residual Plot Rendezvous!
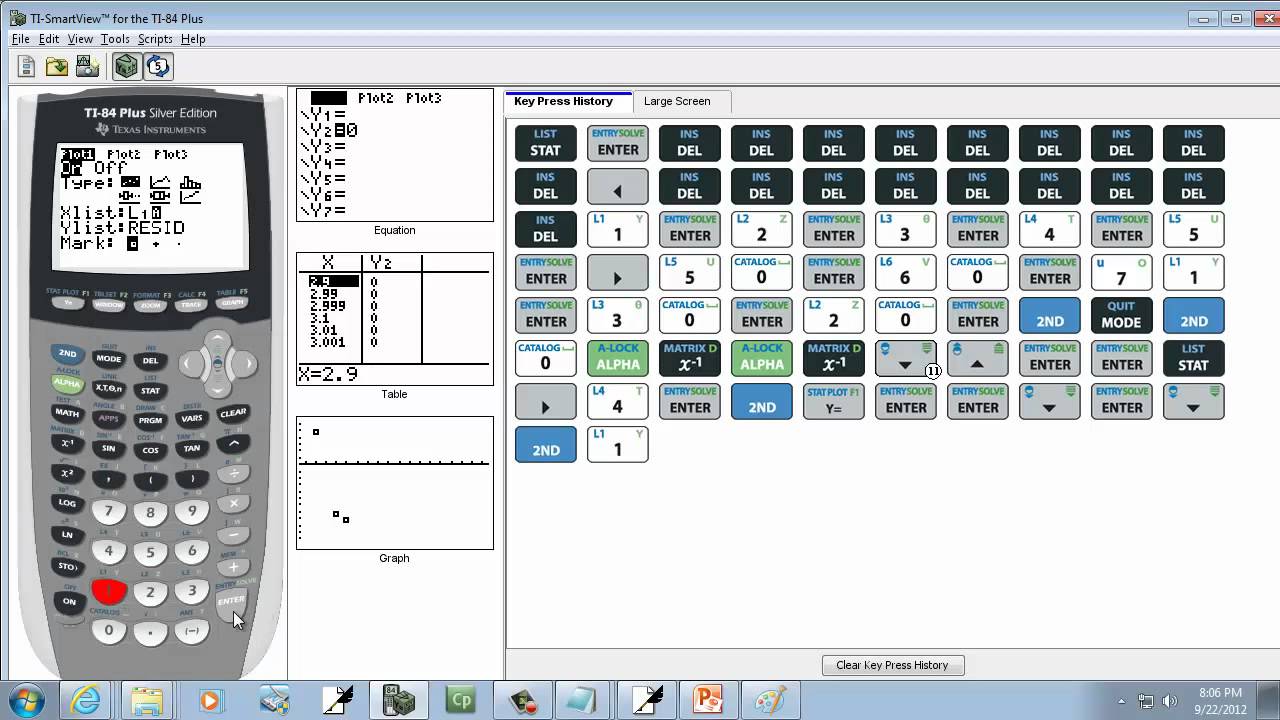
Now comes the coolest part! Let's generate the residual plot. Go back to "STAT PLOT" (2nd + Y=). Edit Plot1 again.
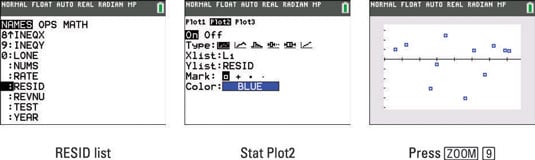
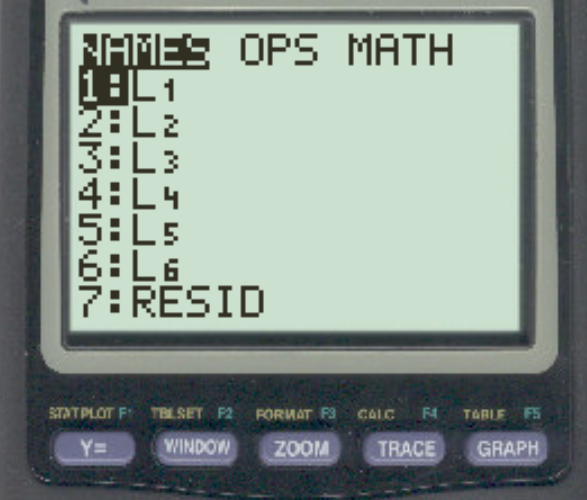
Keep your Xlist as L1. But for the Ylist... Here's the trick! Press "2nd" then "STAT." This will bring up a list of names for your Lists. Scroll down until you find "RESID" and select it. This tells the calculator you want to plot the residuals.
Zooming for the Win!
Time to get a good look at your creation! Hit "ZOOM." Then, select "ZoomStat" (usually option 9). This will automatically adjust your window to perfectly fit your data and residual plot.
There it is! Your very own residual plot. What do you see? Is it scattered randomly? Or is there a pattern lurking within?
Decoding the Dots
A random scatter of dots is a good sign. It suggests your chosen regression model fits the data well. But a pattern? Uh oh!
If you spot a curve or some other organized mess, it might mean a different type of regression would be a better fit. Think quadratic, exponential, or something else entirely!
Why Bother with Residual Plots?
They're like secret decoder rings for your data!
Residual plots reveal whether your regression model is truly capturing the underlying relationships.
It’s a way to peek behind the curtain and see if you're really telling the whole story. It’s data detective work at its finest!
Beyond the Basics: Exploring Further
Want to become a residual plot master? Experiment with different regression types. See how the residual plots change.
Add more data points. See how they influence the plots. The possibilities are endless! Each data set creates unique, exciting, and ultimately interesting plots.
So, grab your TI-84 and start exploring! You might be surprised at what secrets your data is waiting to reveal. Who knew statistics could be so entertaining?