How To Find The Residual On A Ti-84 Plus

Ready for a little adventure with your trusty TI-84 Plus calculator? This isn't your average math lesson. It’s a treasure hunt! We’re diving into the fascinating world of residuals.
First Things First: The Data
Imagine you've got some data points. Maybe you’ve been tracking the growth of your prize-winning tomato plant. Or perhaps you’re following the latest stock market craze! Whatever it is, get that data into your calculator.
Pop your x-values into L1. Then, punch your corresponding y-values into L2. Think of it as setting the stage for some serious calculating fun!
Finding Your Line of Best Fit
Time to get that perfect line! Head to STAT then CALC. Scroll down to LinReg(ax+b) or LinReg(a+bx).
It's like choosing your favorite flavor of ice cream. Pick the one you like the best! Tell the calculator which lists to use like LinReg(ax+b) L1, L2, Y1.
You can store it directly into Y1 for later use. Just type VARS, then Y-VARS, and choose Function, and pick Y1.
Unleashing the Residuals
Now for the magic trick! Your TI-84 Plus likely calculates residuals automatically and stores them in a list called RESID.
Think of RESID as your calculator's secret diary. It holds all the juicy details about how far each point deviates from the line. To access this list is very simple.
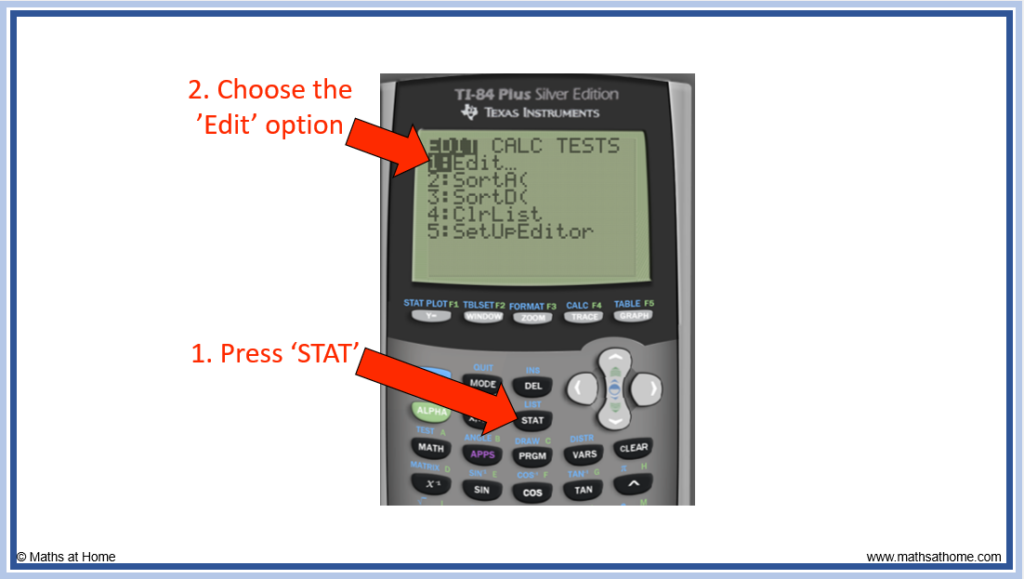
Go to STAT and then EDIT. Look at the column labels. Sometimes, the RESID list pops up automatically. If not, no worries!
Accessing the RESID List (If It's Hiding)
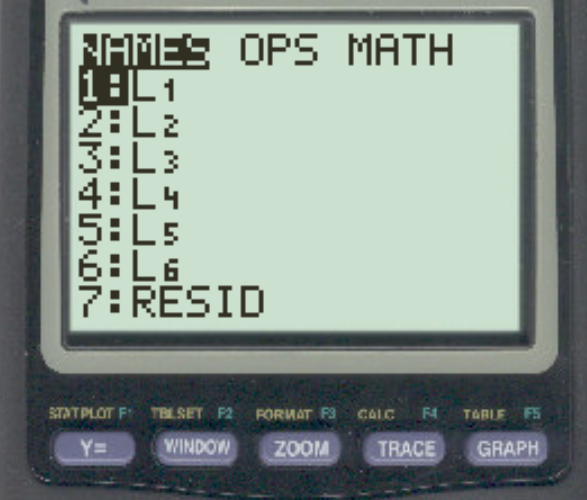
If RESID is playing hide-and-seek, bring it to light! From the home screen, type 2nd, then STAT (which is the LIST button).
Scroll down, down, down till you spot RESID. It's like finding the last piece of a puzzle! Press ENTER, and the list of residuals will appear on your home screen.
Seeing is Believing: Plotting the Residuals
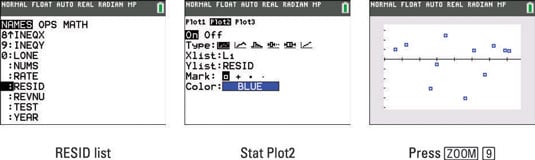
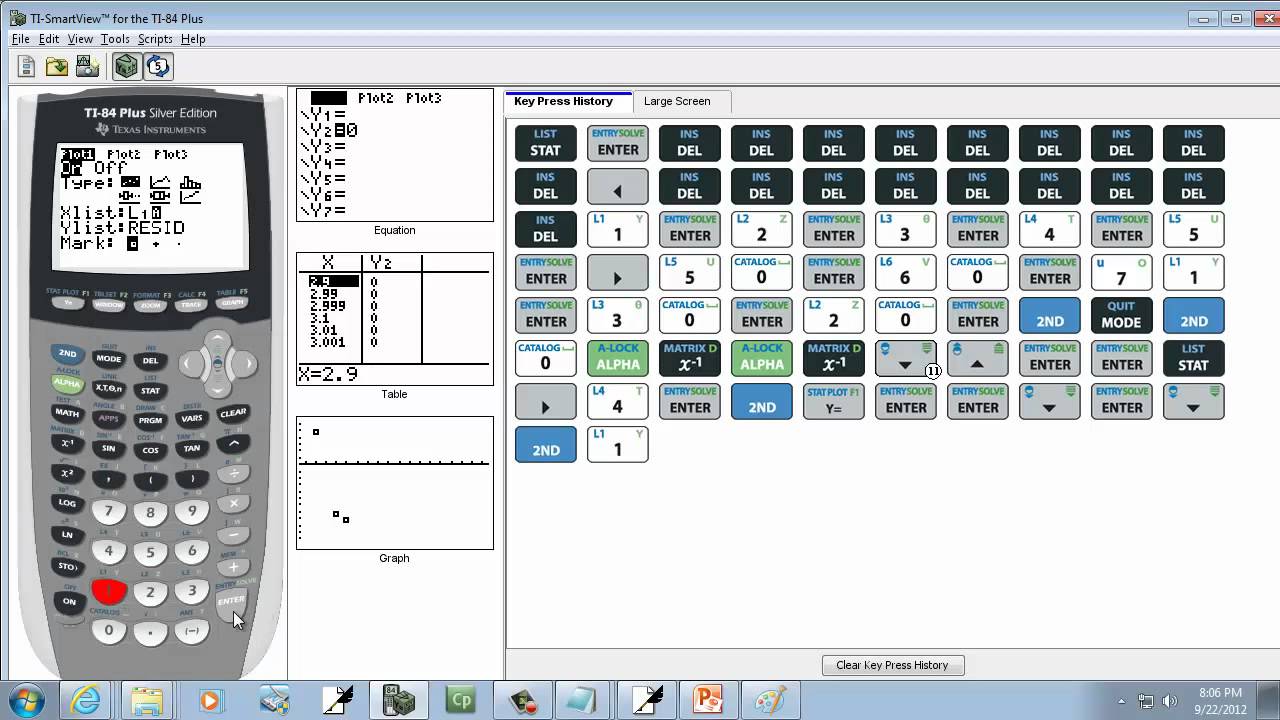
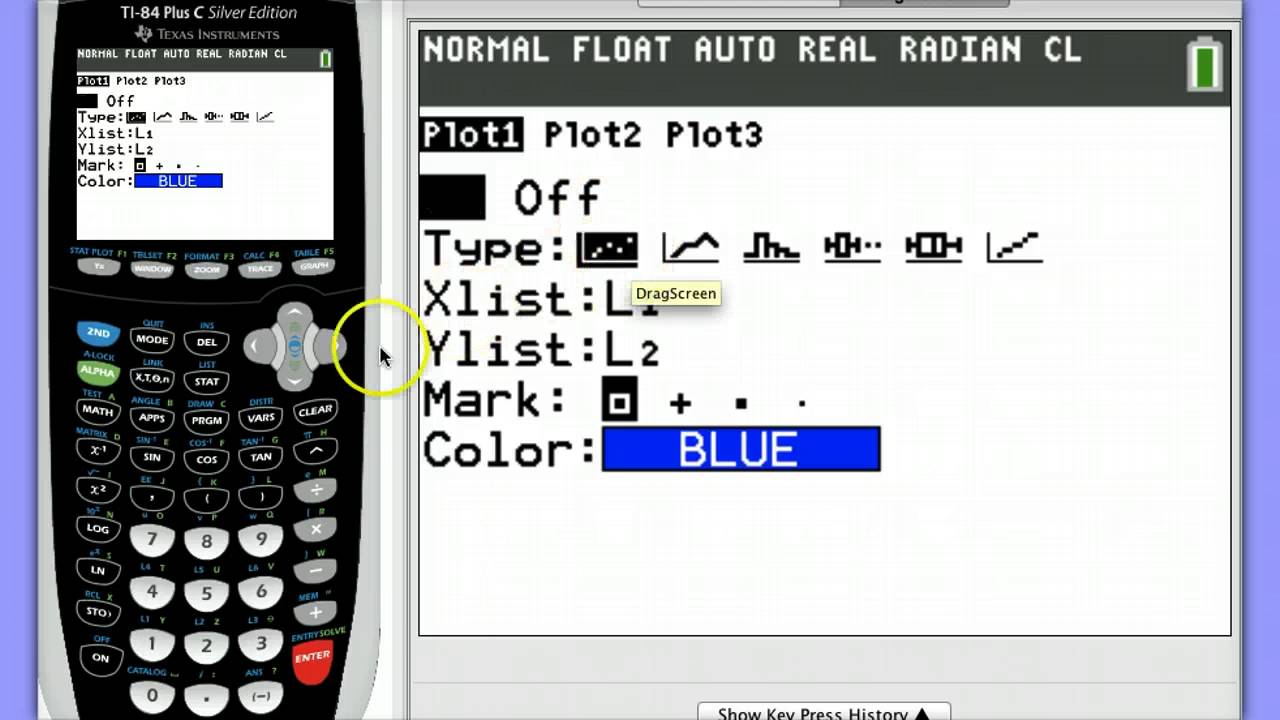
Want to see the residuals in action? Let's plot them! Go to STAT PLOT (2nd then Y=).
Choose a plot and turn it On. For the Xlist, use L1. For the Ylist, choose RESID. It's like giving your data a pair of stylish new glasses!
Hit ZOOM and then ZoomStat. Behold! A scatter plot of the residuals. What a sight.
Interpreting the Residual Plot
A random scattering of points? Great! That means your linear model probably fits the data well. A pattern in the plot? Uh oh! That suggests a linear model may not be the best fit.
It’s like being a detective, using clues to solve a mystery! The residual plot helps you decide if your line is truly the best representation of the data.
Analyzing residuals can be fun. It lets you explore your data in new, insightful ways. So grab your TI-84 Plus and start exploring!