How To Graph Residual Plot On Ti 84
Okay, picture this: you’ve got your trusty TI-84 calculator, the one that's seen you through thick and thin, late-night study sessions fueled by questionable snacks, and maybe even a few tears (don't worry, we've all been there). Now, you're ready to make a residual plot.
Getting Started: Inputting Your Data
First, you gotta tell the calculator what you're working with. That means entering your data. Think of it like introducing your calculator to the main characters of your statistical drama.
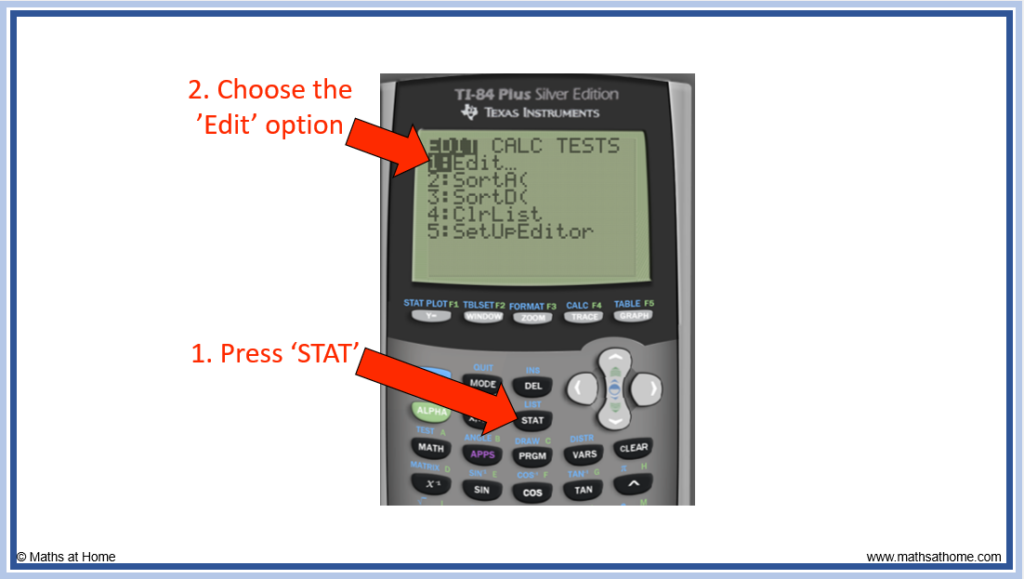
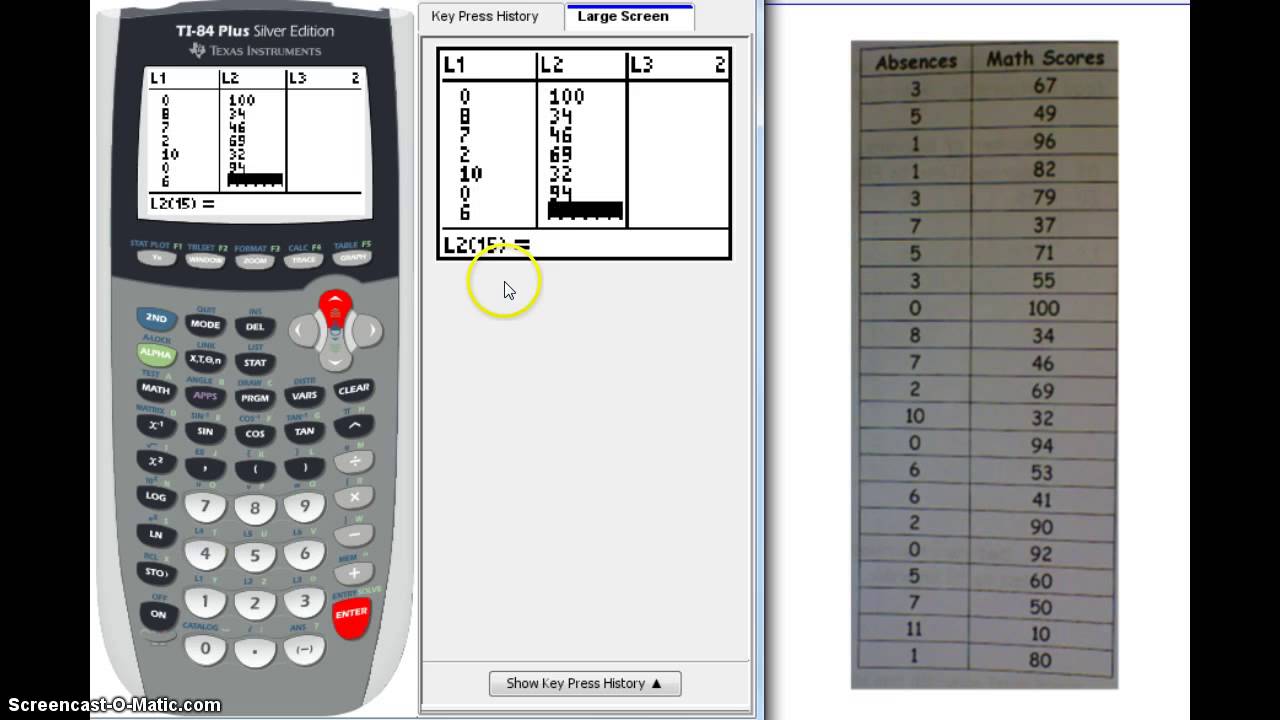
Hit the "STAT" button. It's usually somewhere near the top, looking important. Choose "Edit" from the menu that pops up.
See those lists, L1, L2, maybe even L3 if you're feeling ambitious? That's where your data goes! Put your independent variable (the 'x' stuff) into L1 and your dependent variable (the 'y' stuff) into L2.
Finding the Regression Line
Now, let's find the line that best fits your data points. It’s like finding the perfect outfit for a first date… except instead of a date, it's your data.
Press "STAT" again and navigate to "CALC". Find "LinReg(ax+b)" or something similar (linear regression). Select it.
Make sure it says L1, L2. If not, tell it where your x and y values are. Then hit "Calculate." Behold! Your equation appears. Store this equation in Y1.
Calculating Those Residuals
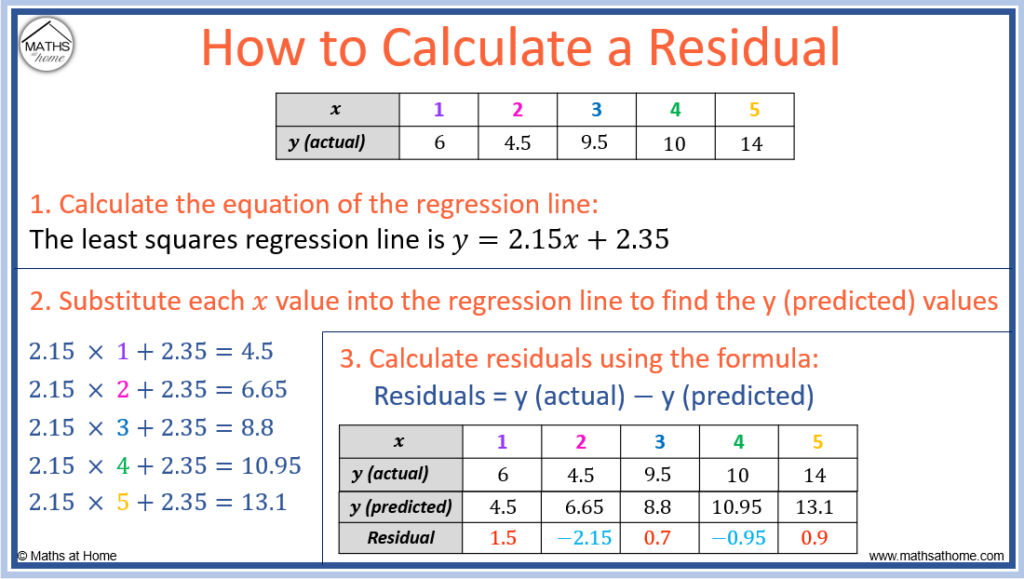
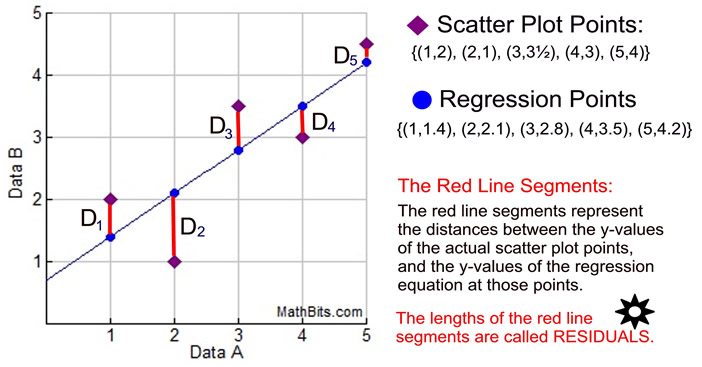
Time for the fun part! These are the differences between your actual data points and the values predicted by your fancy regression line. Think of residuals as the leftovers after you’ve carved out the best “fit”.
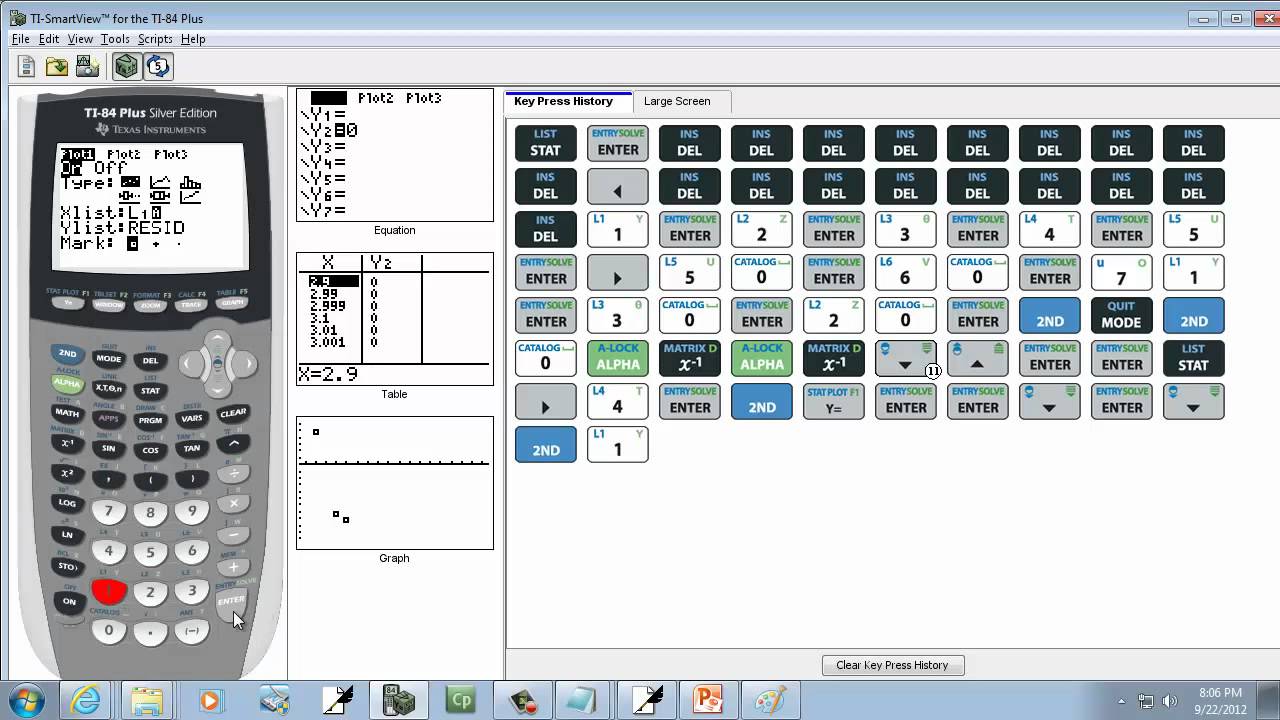
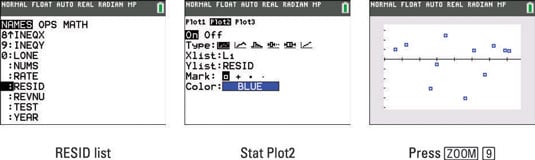
Go back to the "STAT" menu and then to "EDIT." Here, you'll notice that your calculator has magically created a list called "RESID." If it is there, your calculator remembered your values. If not, you will need to store the residuals.
Go back to the home screen. Calculate the residuals manually by subtracting the predicted y-values from the actual y-values. Store this in L3.
Plotting the Residual Plot
Now it's time to visualize those residuals! This is where the plot thickens, literally.
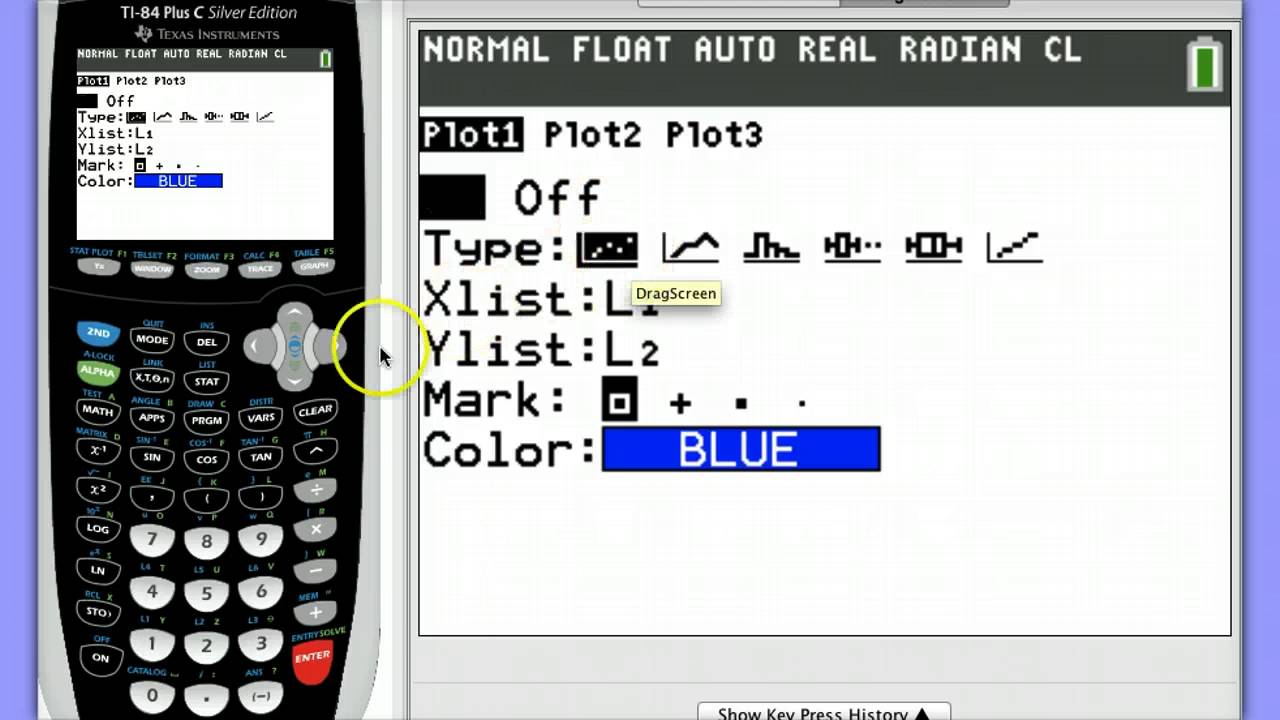
Press "2nd" then "Y=". This takes you to the Stat Plot menu. Select "Plot1" (or any other plot that's turned off).
Turn the plot "On". Choose the scatter plot icon (the one with the dots). Tell it that your Xlist is L1 (your original x-values). Tell it that your Ylist is L3.
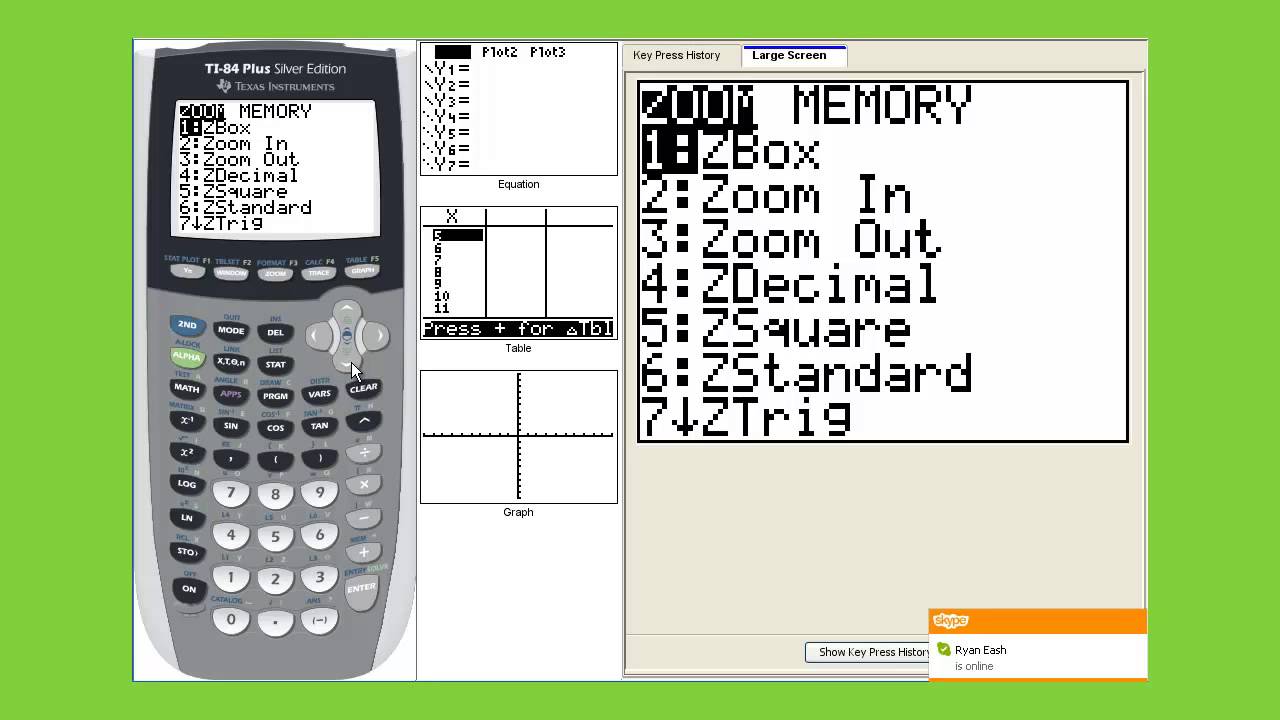
Hit "Zoom" and then "ZoomStat" (usually option 9). Boom! There's your residual plot.
Interpreting the Plot (Briefly!)
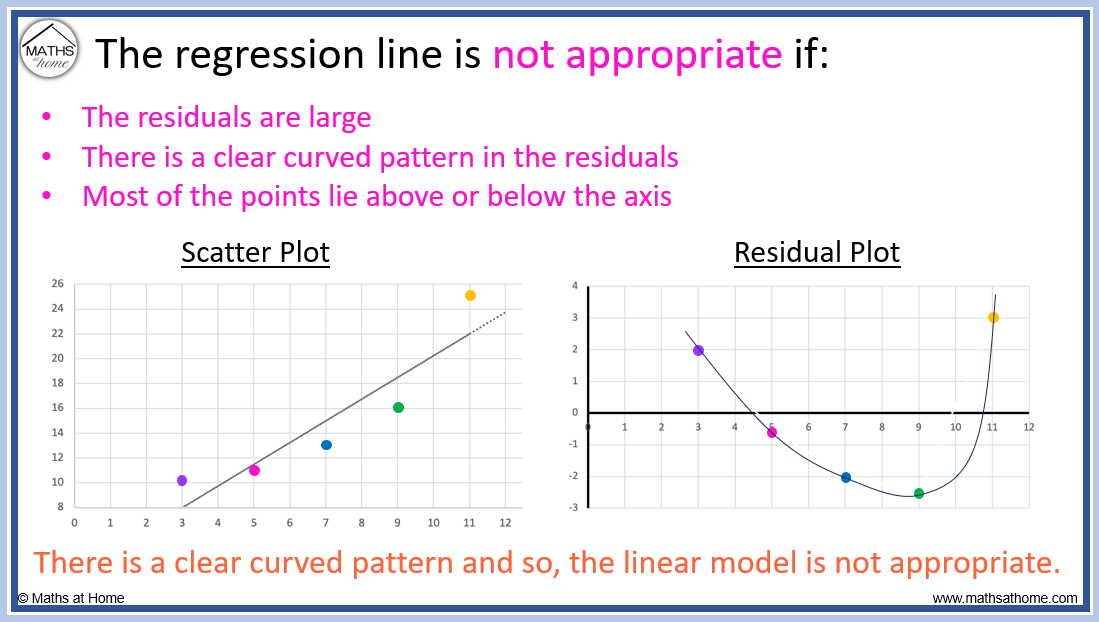
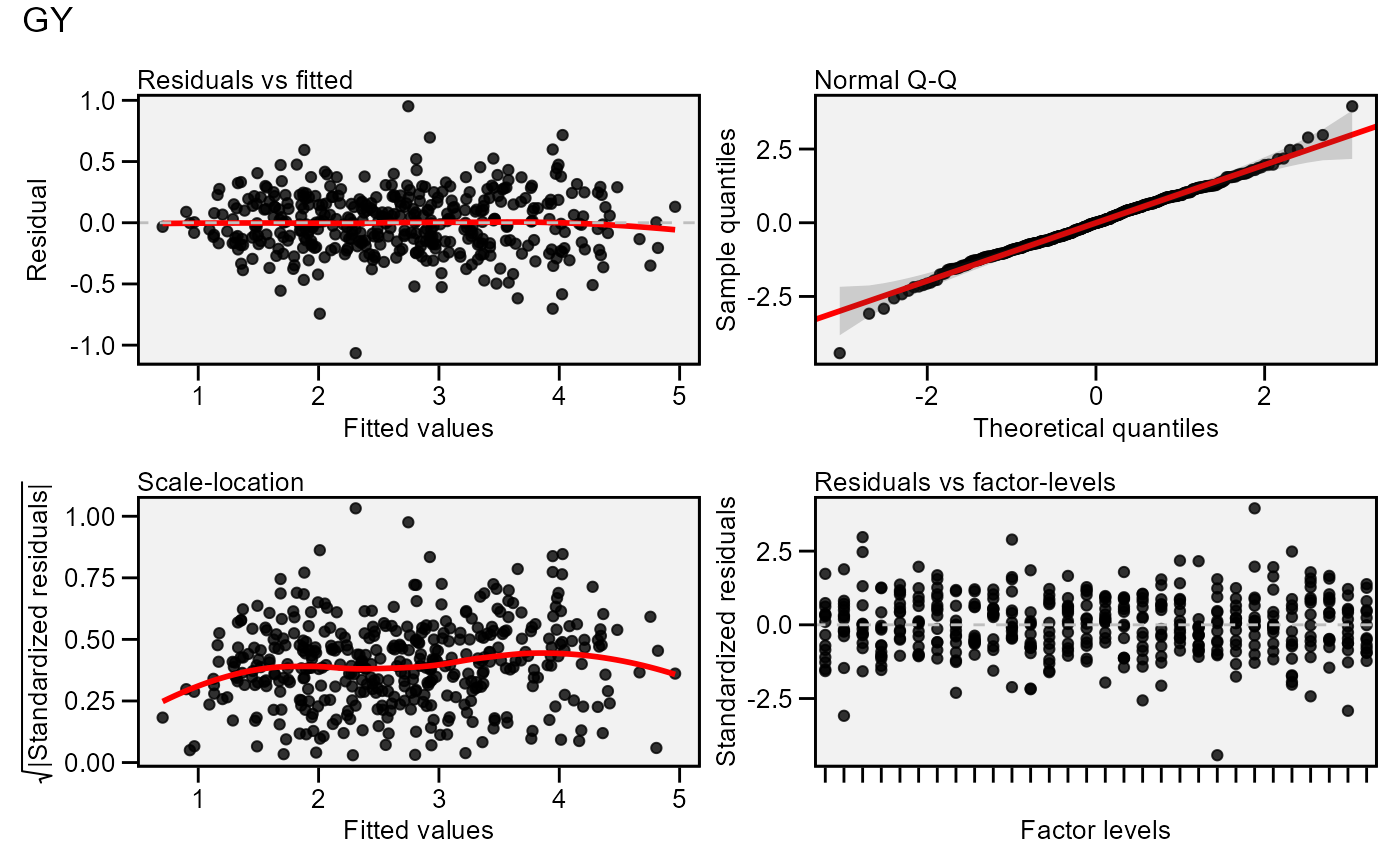
Look for patterns. Random scatter? Good! That means your linear model is probably a decent fit.
U-shaped patterns or other non-randomness? Uh oh. Your data might be trying to tell you that a linear model isn't the best choice. Maybe it wants a quadratic or exponential relationship.
You have just created a residual plot on your TI-84. Wasn’t that fun?