How To Graph Residuals On Ti 84
Ready for some calculator fun? Let's dive into graphing residuals on your trusty TI-84. It's like detective work, but with numbers! Get ready to uncover hidden patterns and become a data whisperer.
First, The Setup
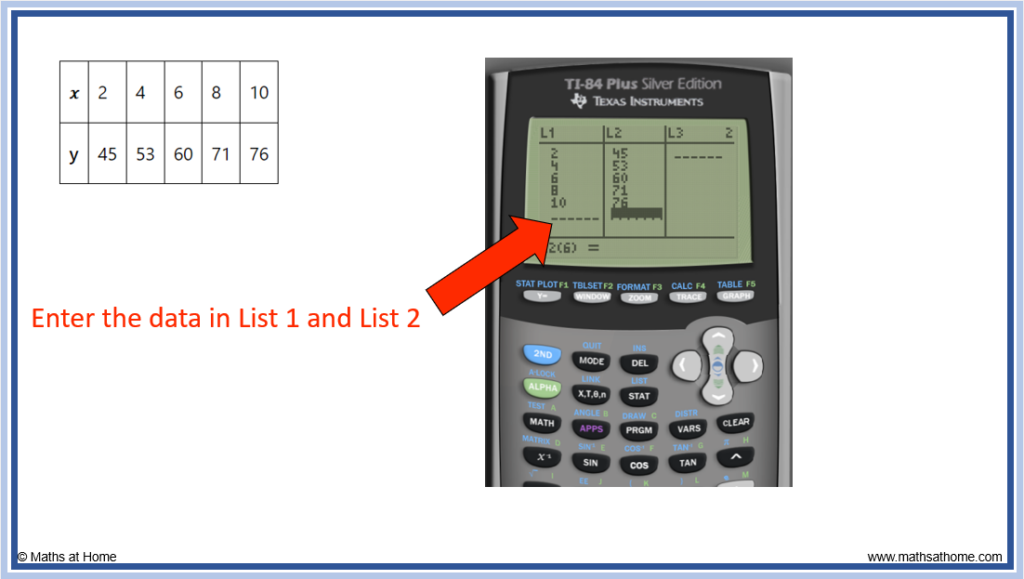
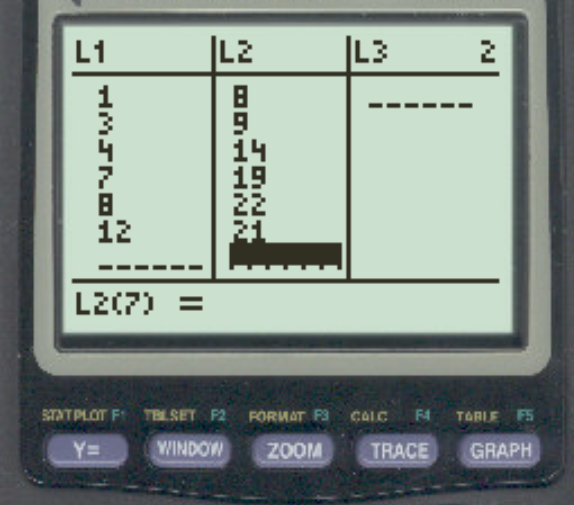
Enter your data into lists L1 and L2. Think of it as feeding your calculator a delicious data smoothie. Make sure your x-values are in L1 and y-values in L2.
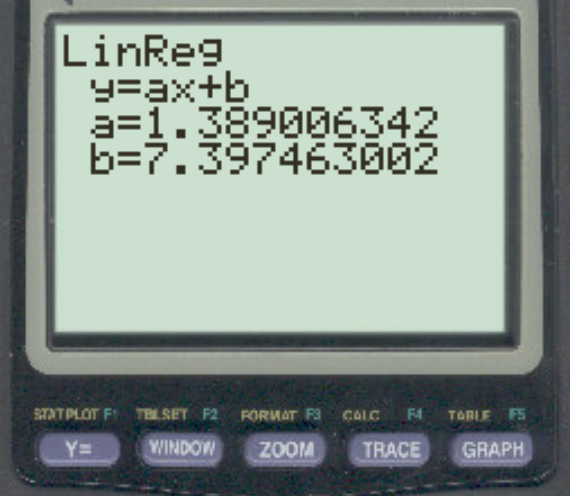
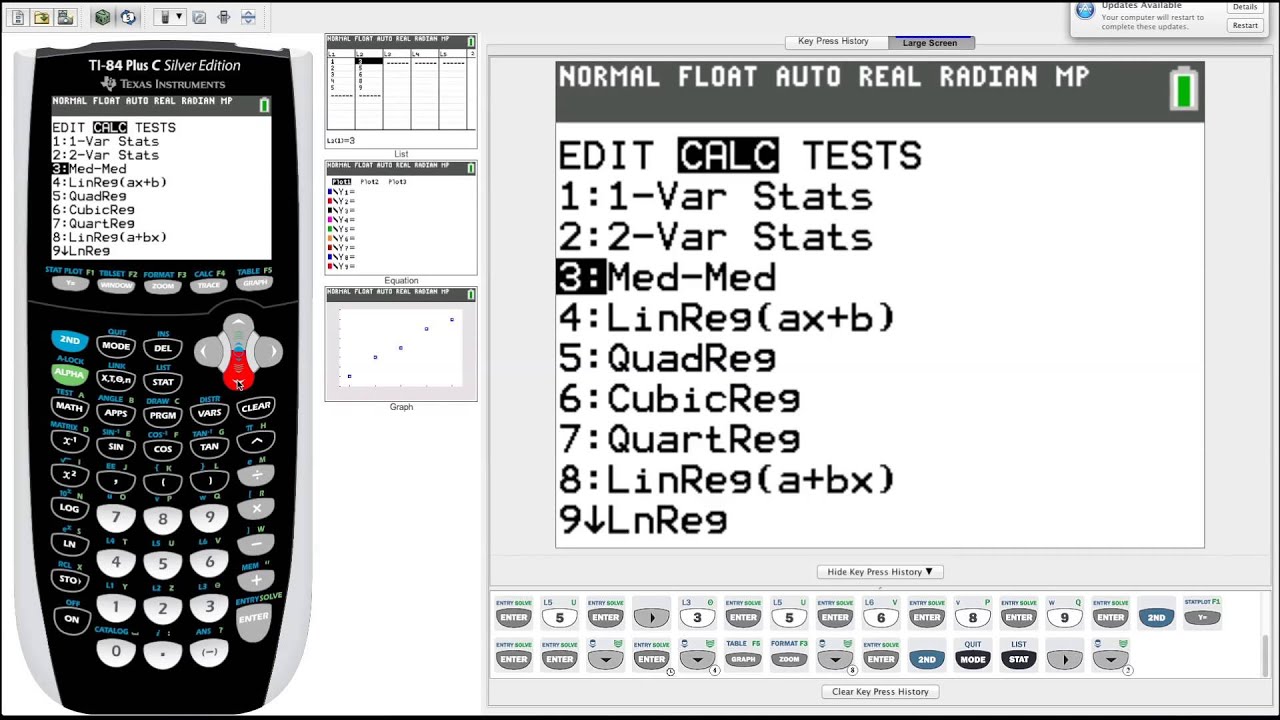
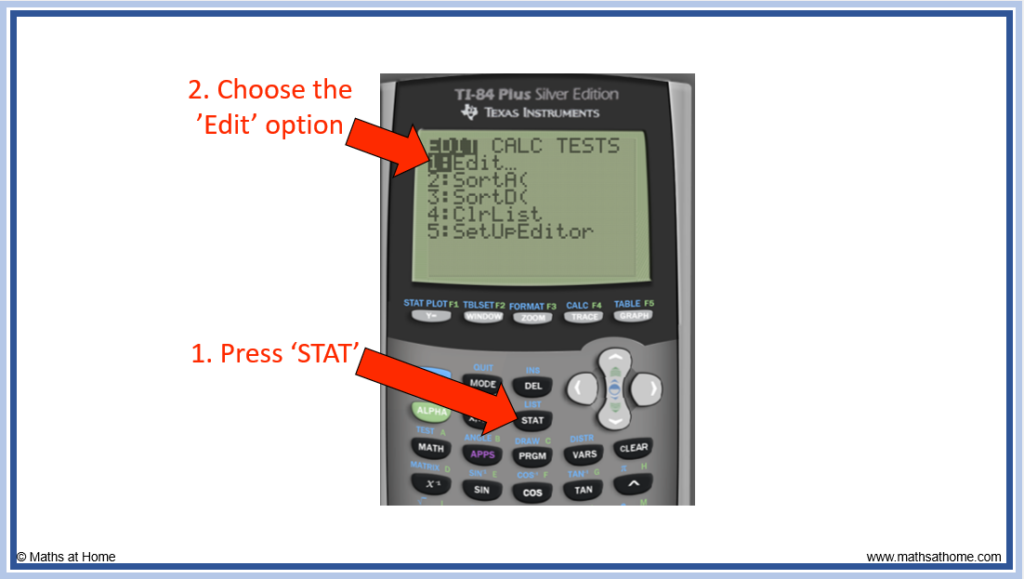
Next, run your regression. Press STAT, then arrow over to CALC. Choose your favorite regression type – maybe linear (LinReg(ax+b)) or quadratic (QuadReg). Tell it where your data lives: LinReg(ax+b) L1,L2,Y1.
That "Y1" part? That's important! It stores the equation, like stashing treasure.
Residual Plot Magic
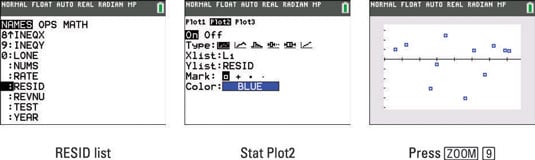
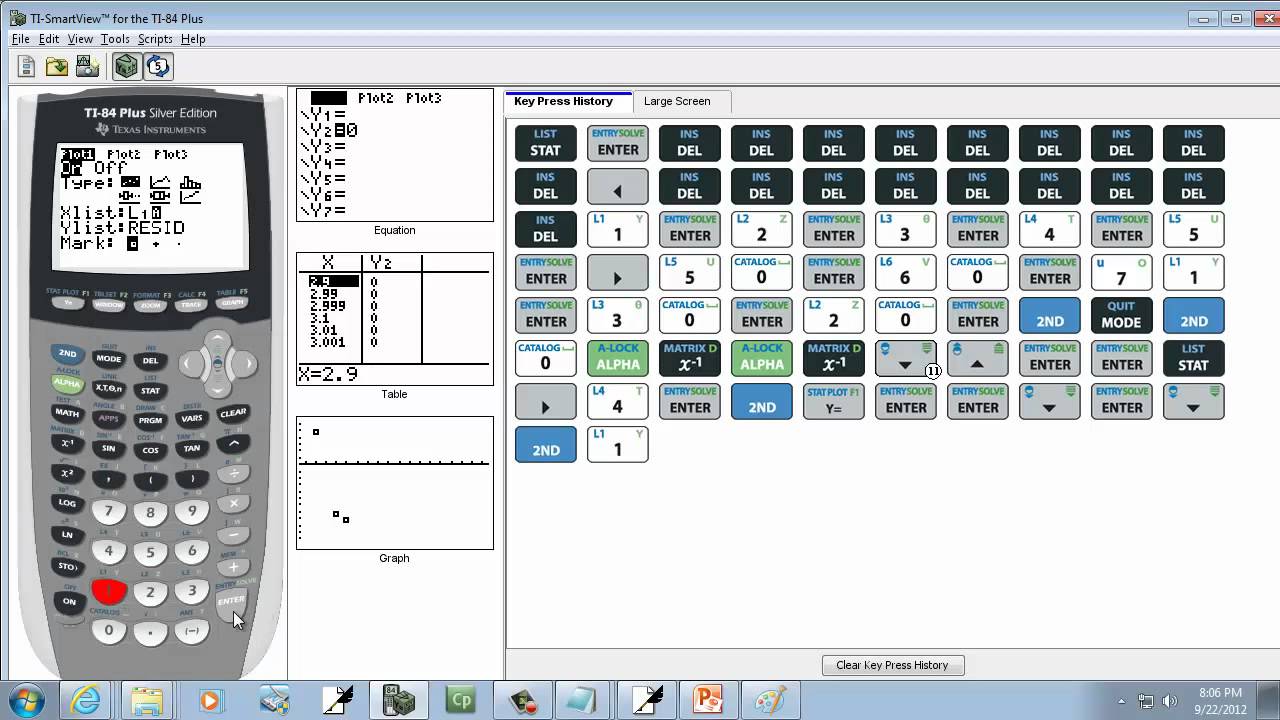
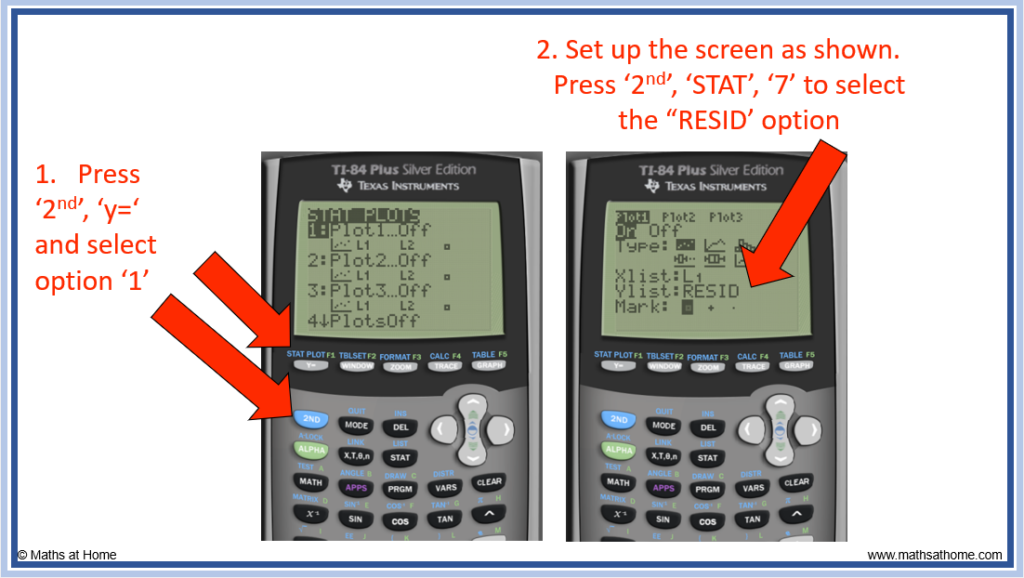
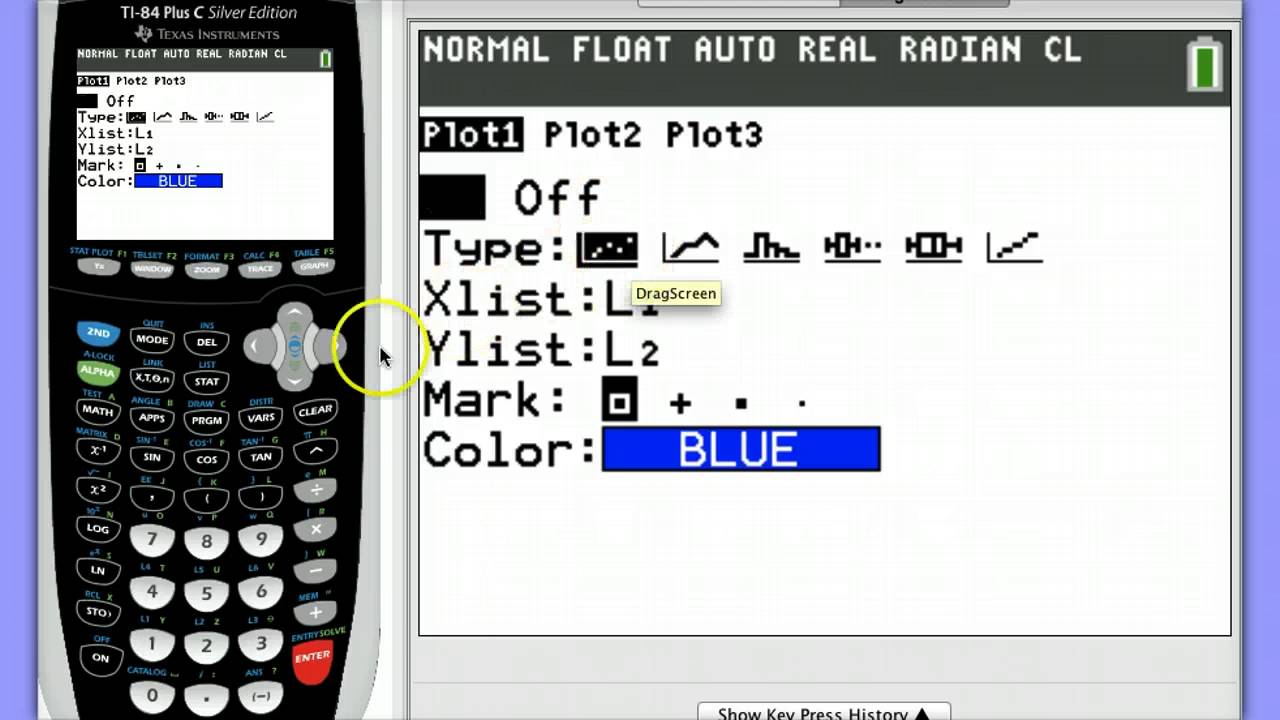
Now for the fun part: creating the residual plot. Go to STAT PLOT (2nd + Y=). Turn Plot1 ON.
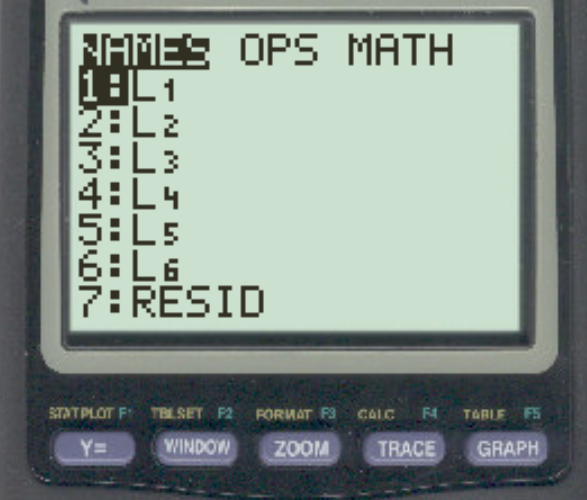
Choose the scatter plot icon (the one with the dots). For Xlist, select L1. For Ylist, type "RESID" (2nd + STAT, then scroll down). It's like giving your calculator a secret code!
Hit ZOOM, then ZoomStat. Voila! A residual plot appears. Isn't it beautiful?
Interpreting the Chaos
What are you looking for? Randomness is key. We want to see points scattered all over the place. Like confetti after a celebration!
If you see a pattern (like a curve or a funnel), your model might not be the best fit. It's like wearing shoes that are a size too small. Uncomfortable!
No pattern? Hooray! Your model is doing a good job. Give yourself a pat on the back.
Extra Tips and Tricks
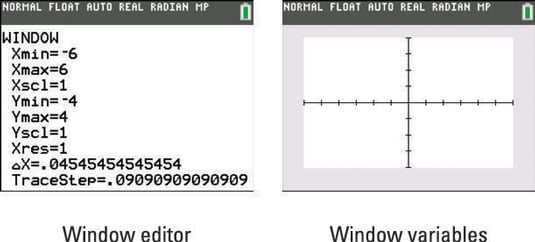
Want to get fancy? Turn on the axes to see the x and y axis. Press 2nd + FORMAT and select AxesOn. It's like adding a frame to your masterpiece.
Adjust your window if you don't see the whole plot. Play around with the WINDOW settings. Think of it as adjusting the focus on a camera.
Clear your calculator's memory sometimes (2nd + MEM, then Clear All Lists). It's like decluttering your room. A fresh start!
Lost? Don't panic! There are tons of TI-84 tutorials online. YouTube is your friend.
Why Bother?
Why go through all this trouble? Because understanding residuals helps you choose the best model for your data. It's like finding the perfect recipe for a delicious cake!
It also helps you identify outliers – those pesky data points that don't quite fit. They're like the odd socks in your drawer.
So go ahead, give it a try. Graphing residuals might sound intimidating, but it's surprisingly fun. And who knows? You might just discover something amazing about your data.
Ready to unlock the secrets hidden within your data? Grab your TI-84 and start exploring!