How To Add A Total Row In Access
In the realm of data management, Microsoft Access remains a stalwart tool for businesses and individuals alike. A common task for Access users is summarizing data, and adding a total row to a datasheet or report is a fundamental skill. Misunderstanding this process can lead to inefficient data analysis and reporting errors, impacting decision-making across various sectors.
This article provides a comprehensive guide on how to add a total row in Microsoft Access, offering step-by-step instructions and exploring different methods to achieve accurate and insightful data summarization. We will delve into using the Totals button in Datasheet view, utilizing aggregate functions in queries, and implementing calculated fields in reports. This knowledge is vital for anyone working with Access databases who needs to quickly calculate and display summary data.
Adding a Total Row in Datasheet View
The simplest method for adding a total row in Access is through the Totals button in Datasheet view. This is ideal for quick aggregations when you are directly viewing the data in a table or query.
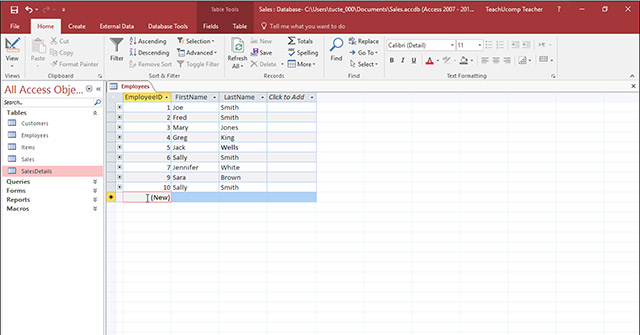
To begin, open the table or query in Datasheet view. Navigate to the Home tab on the ribbon.
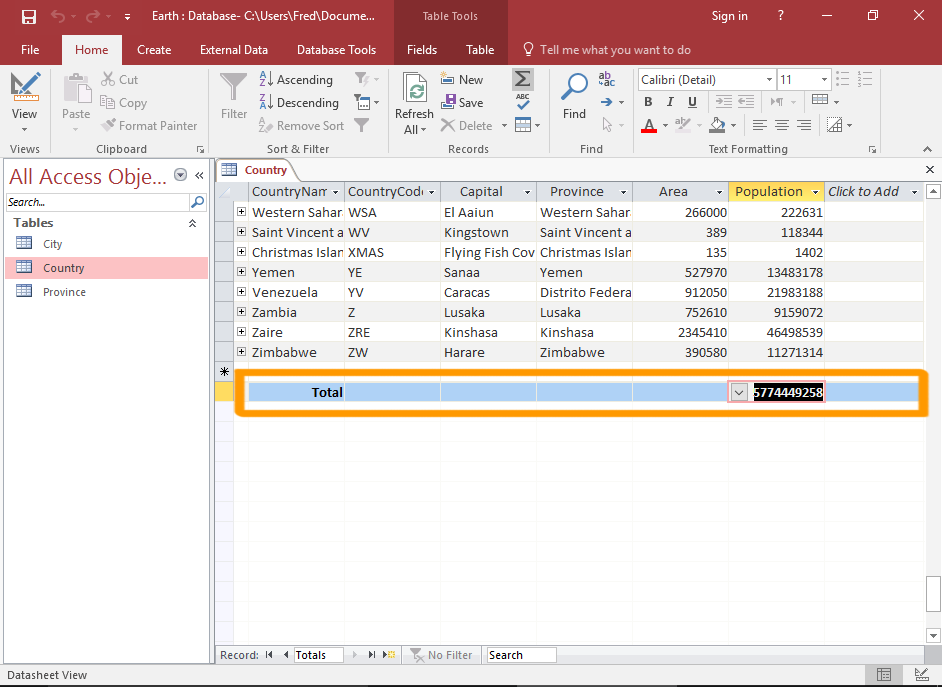
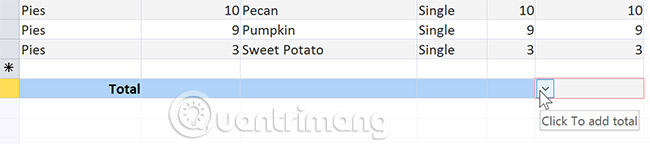
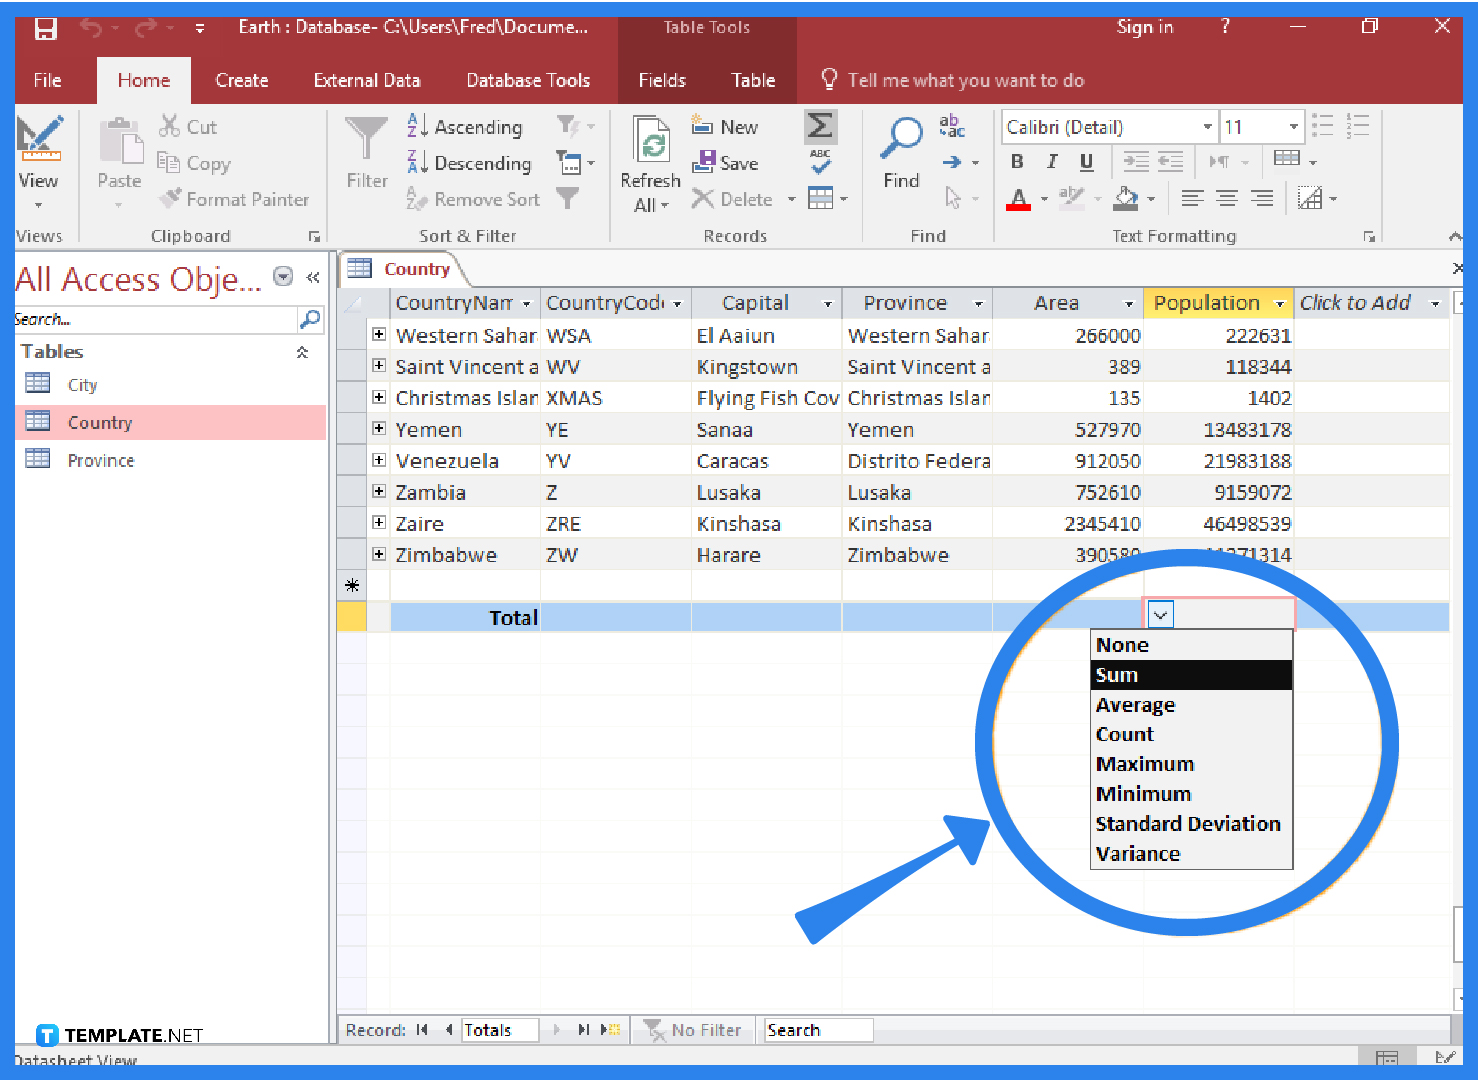
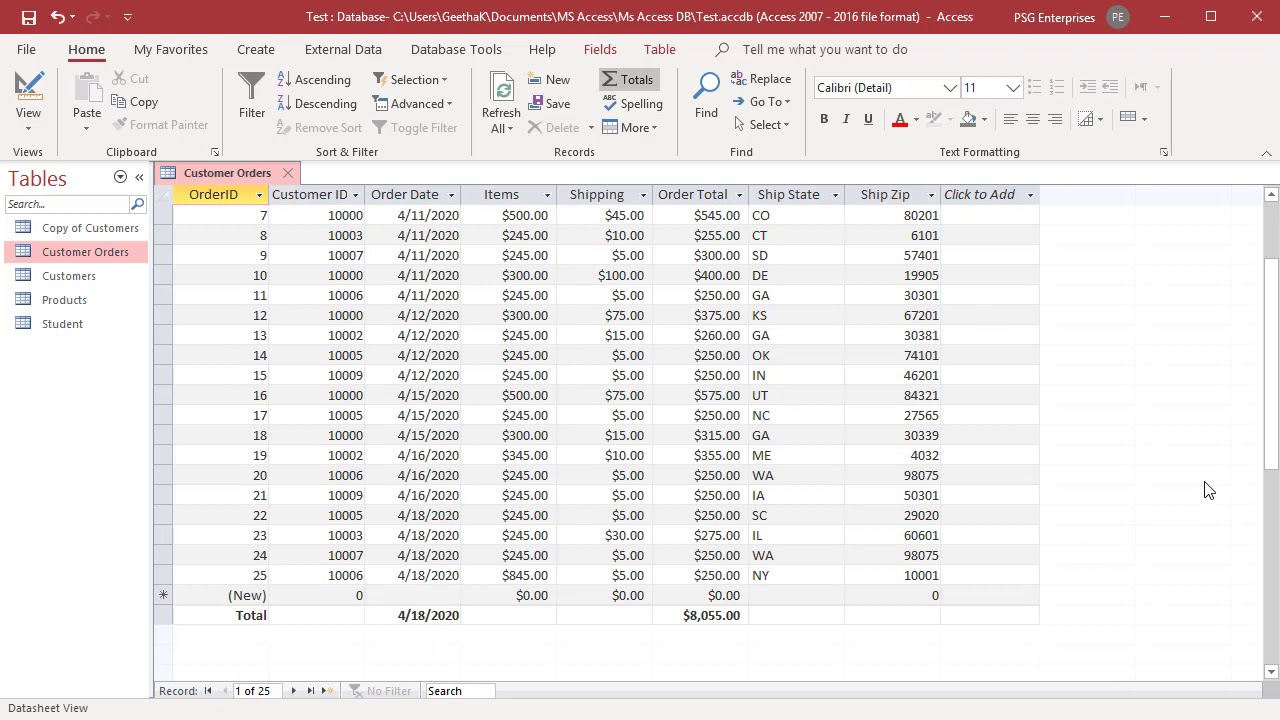
In the Records group, click the Totals button. A new row, labeled "Total," will appear at the bottom of the datasheet.
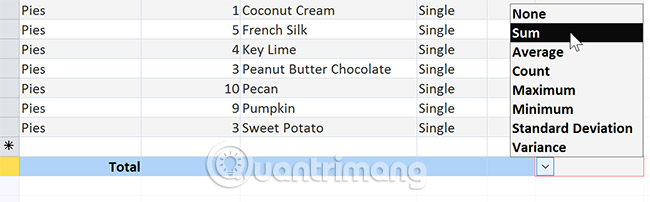
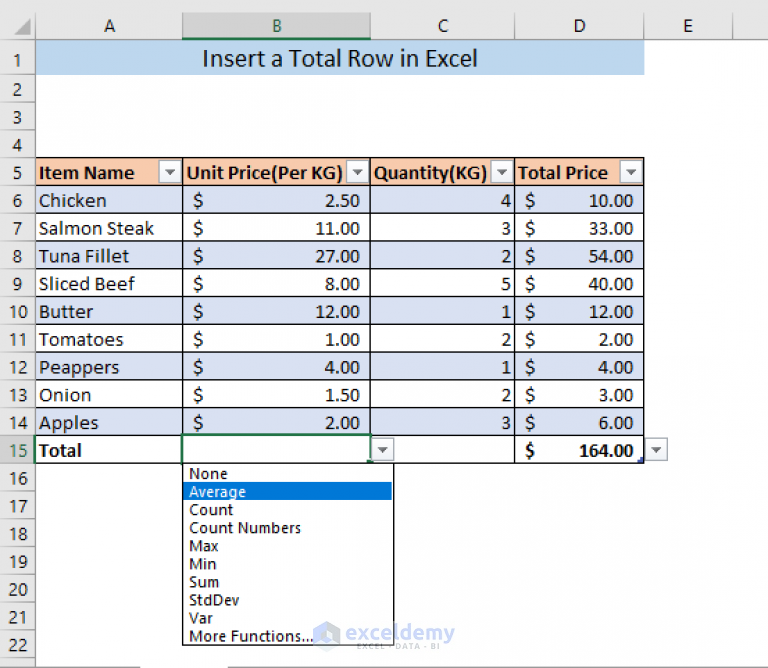
Click in the "Total" row under the field you want to summarize. A dropdown list will appear, presenting various aggregate functions such as Sum, Avg, Count, Min, and Max.
Select the appropriate aggregate function for your needs. Access will automatically calculate and display the result in the "Total" row.
This method is quick and easy, but it has limitations. It only works in Datasheet view and offers limited customization options.
Using Aggregate Functions in Queries
For more complex aggregations and greater control over the output, using aggregate functions in queries is recommended. This method allows you to group data and calculate summary statistics for each group.
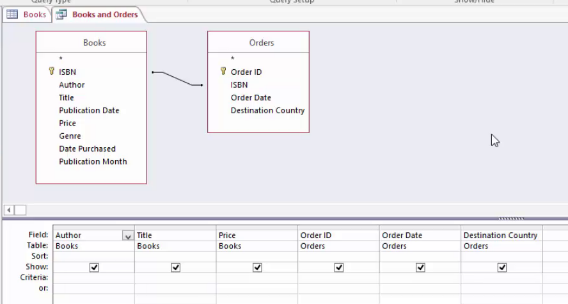
Create a new query in Design view. Add the table(s) containing the data you want to analyze to the query designer.
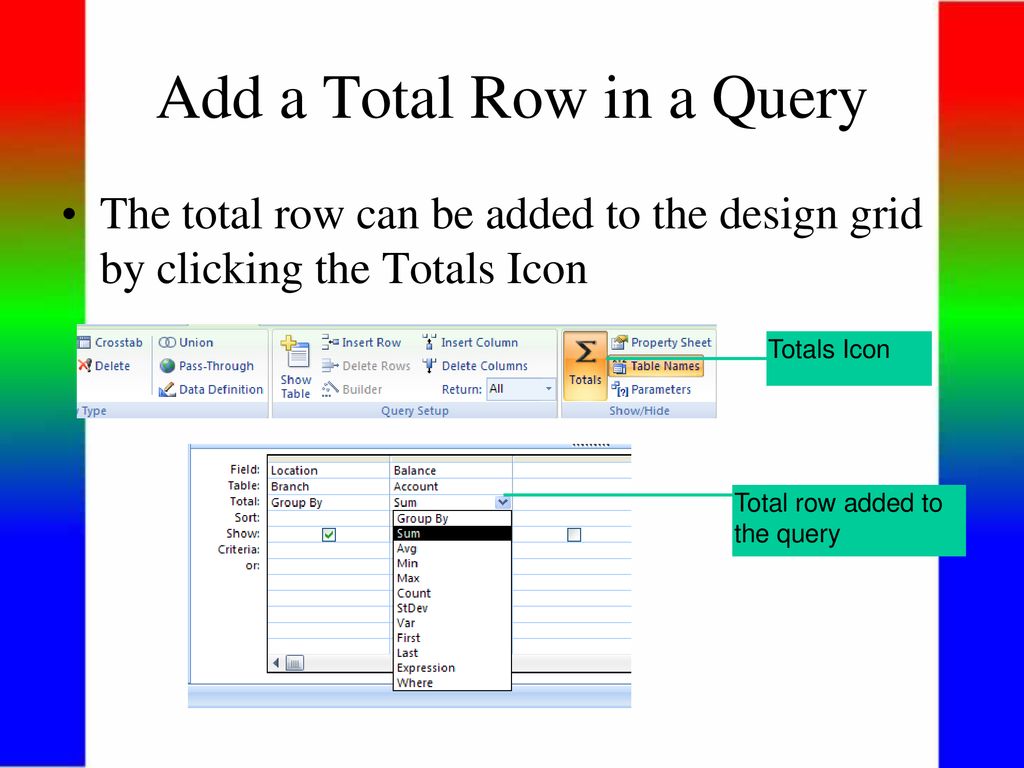
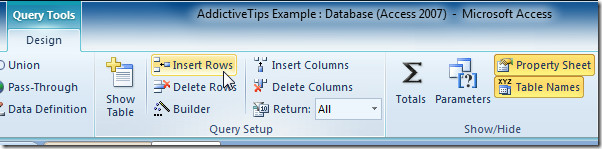
On the Design tab, in the Show/Hide group, click the Totals button. A "Total" row will appear in the query design grid.
In the "Total" row, for the field(s) you want to group by, select "Group By." For the field(s) you want to aggregate, select the appropriate aggregate function (e.g., Sum, Avg, Count).
Run the query. The results will display the grouped data along with the calculated aggregate values. This provides a powerful and flexible way to summarize data based on specific criteria.
For example, to calculate the total sales per region, you would group by the "Region" field and sum the "Sales" field.
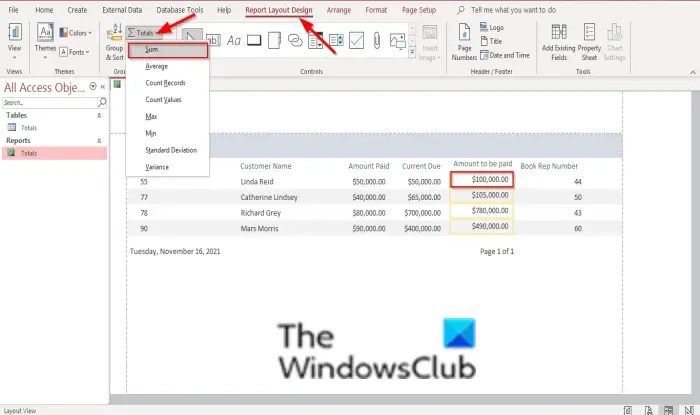
Implementing Calculated Fields in Reports
Adding a total row to a report requires a different approach, often involving calculated fields. This method provides the most control over the appearance and placement of the total row within the report.
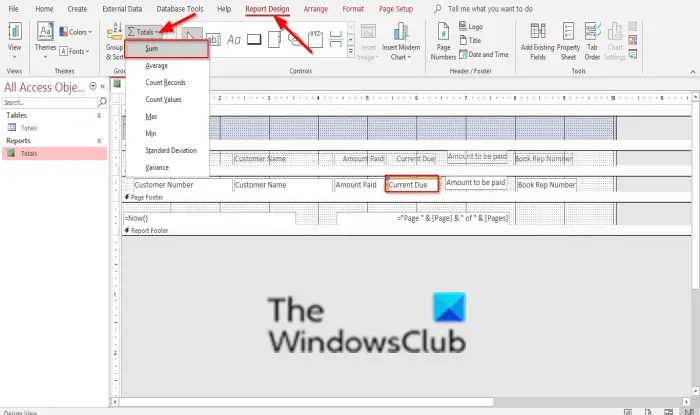
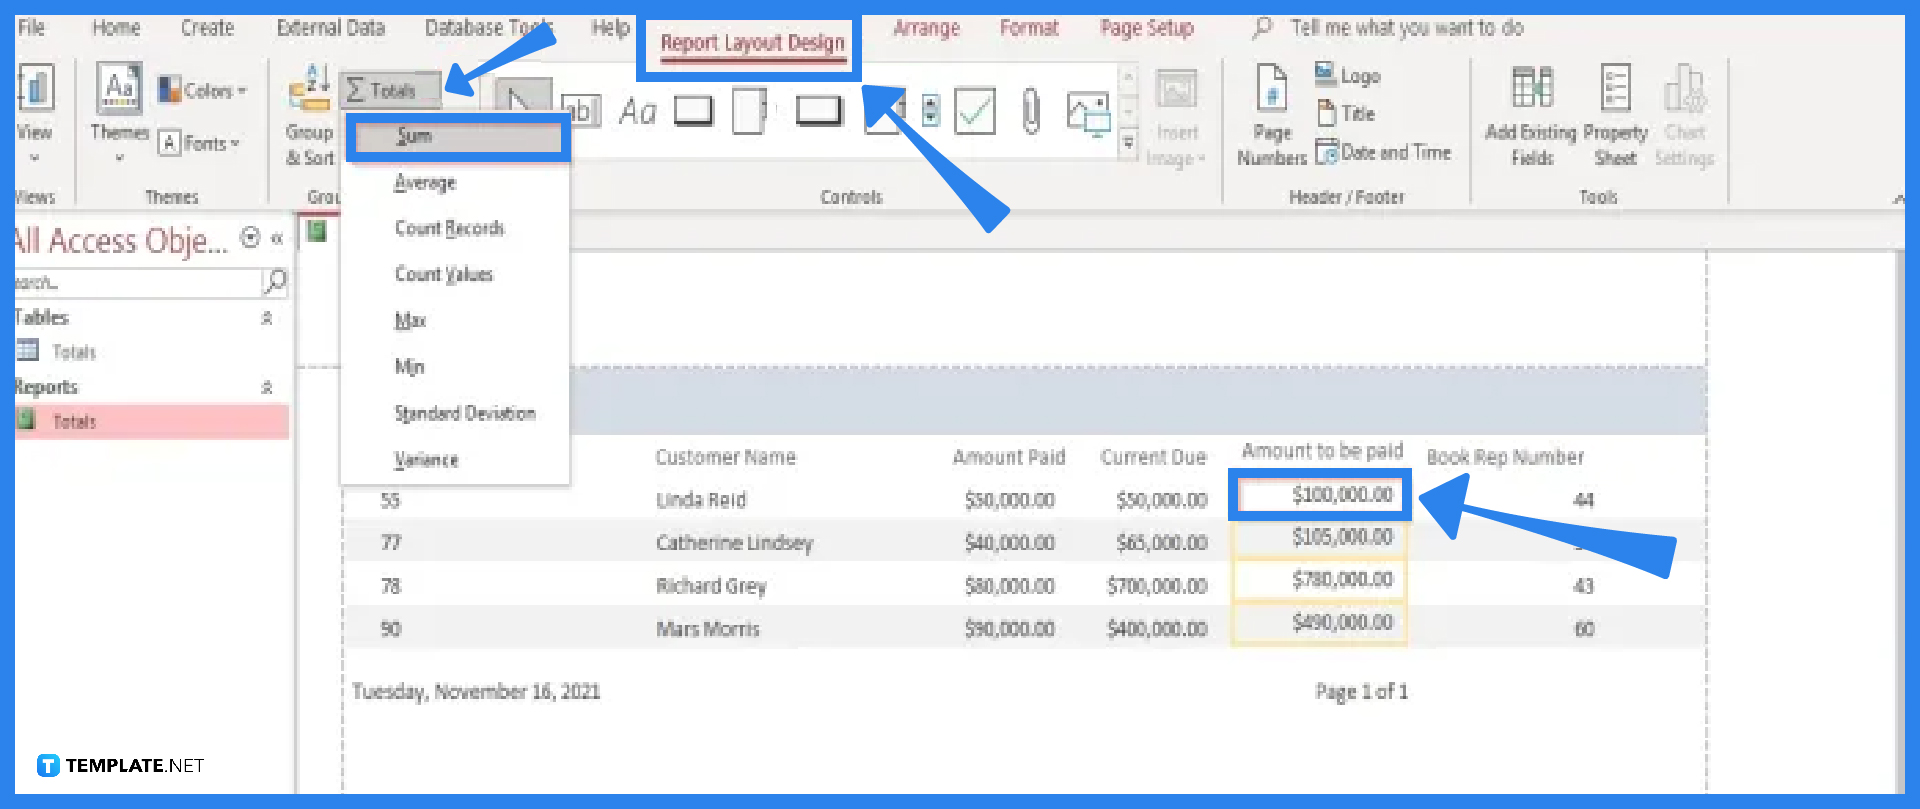
Open your report in Design view. Add a text box control to the report footer.
In the Control Source property of the text box, enter an expression that calculates the sum of the desired field. For example, =Sum([Sales]) would calculate the sum of the "Sales" field.
Format the text box to display the calculated total appropriately. You can adjust the font, size, and number format as needed.
You can also add labels to the text box to clearly indicate what the total represents (e.g., "Total Sales:"). This method offers the most customization for displaying summary data in reports.
Consider using conditional formatting to highlight the total row or apply different formatting based on the value of the total.
Considerations and Best Practices
When adding total rows, it's crucial to consider the data type of the fields being summarized. Ensure that you are using the appropriate aggregate functions for each data type (e.g., Sum for numeric fields, Count for text fields).
Be mindful of potential errors caused by Null values. Use the Nz function to convert Null values to zero or another appropriate value before performing calculations. For instance, =Sum(Nz([Sales],0)) will treat Null values in the "Sales" field as zero.
When working with large datasets, consider optimizing your queries to improve performance. Indexing relevant fields can significantly speed up the aggregation process.
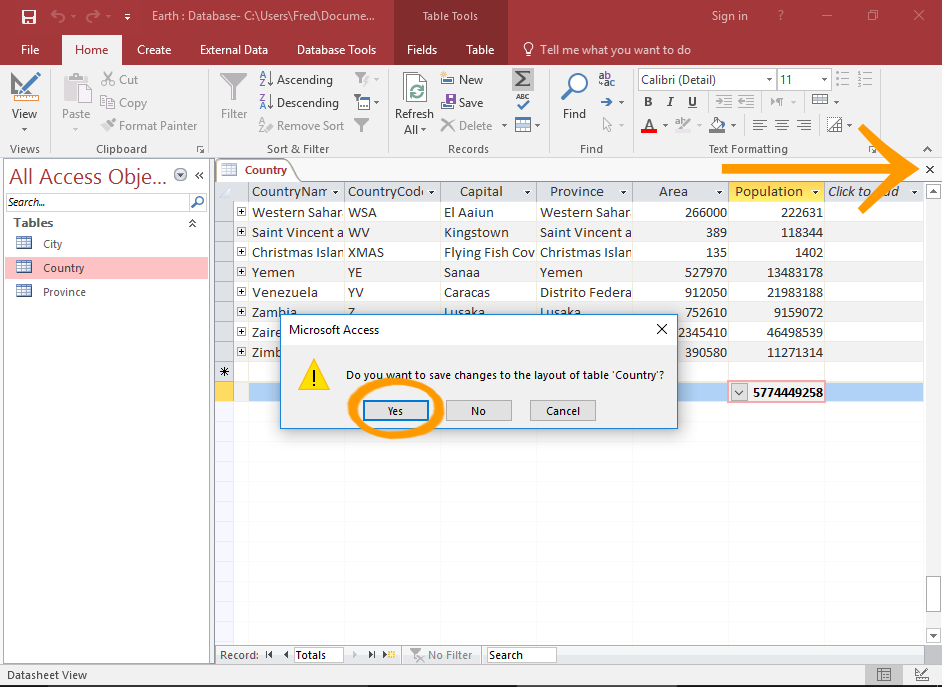
Always test your total rows thoroughly to ensure that they are calculating correctly. Compare the results with manual calculations or other data sources to verify accuracy.
Document your calculations and assumptions clearly. This will help others understand how the total rows were created and ensure consistency across reports and analyses.
The Future of Data Summarization in Access
Microsoft continues to update Access, though major overhauls are infrequent. Features like improved integration with Power BI hint at a future where Access handles data collection and basic management, with more robust analysis handled by other tools. Mastering fundamental techniques like adding total rows remains essential for leveraging Access's capabilities effectively, even as the data landscape evolves. These foundational skills provide a strong base for transitioning to other data analysis platforms if needed.
By mastering these techniques, users can efficiently summarize and analyze data in Access, gaining valuable insights and supporting informed decision-making. Understanding the different methods and their limitations is key to choosing the most appropriate approach for each situation.