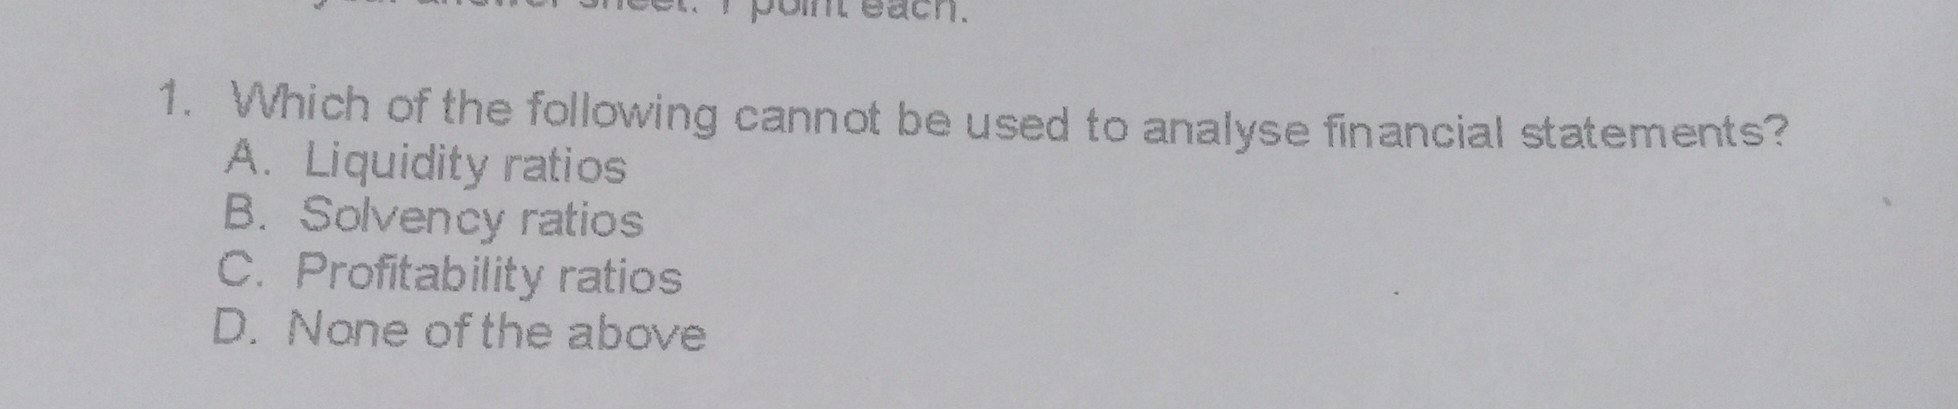
Which Of The Following Is Not A Solvency Ratio

Imagine you're scaling a financial mountain. Each step requires careful planning, each foothold needs to be secure. One wrong move, and you could find yourself tumbling downwards. In the world of business, this mountain represents financial stability, and solvency ratios are your climbing gear. These ratios are essential tools for assessing a company's ability to meet its long-term obligations, separating the financially robust from those teetering on the edge.
But understanding which financial tools are *not* solvency ratios is just as vital. It’s crucial for investors, analysts, and business owners to discern the difference and apply the right metrics for effective financial analysis. This article delves into the world of financial ratios, clarifying which ones fall under the umbrella of solvency and highlighting one that stands apart, preventing potential missteps in financial assessments.
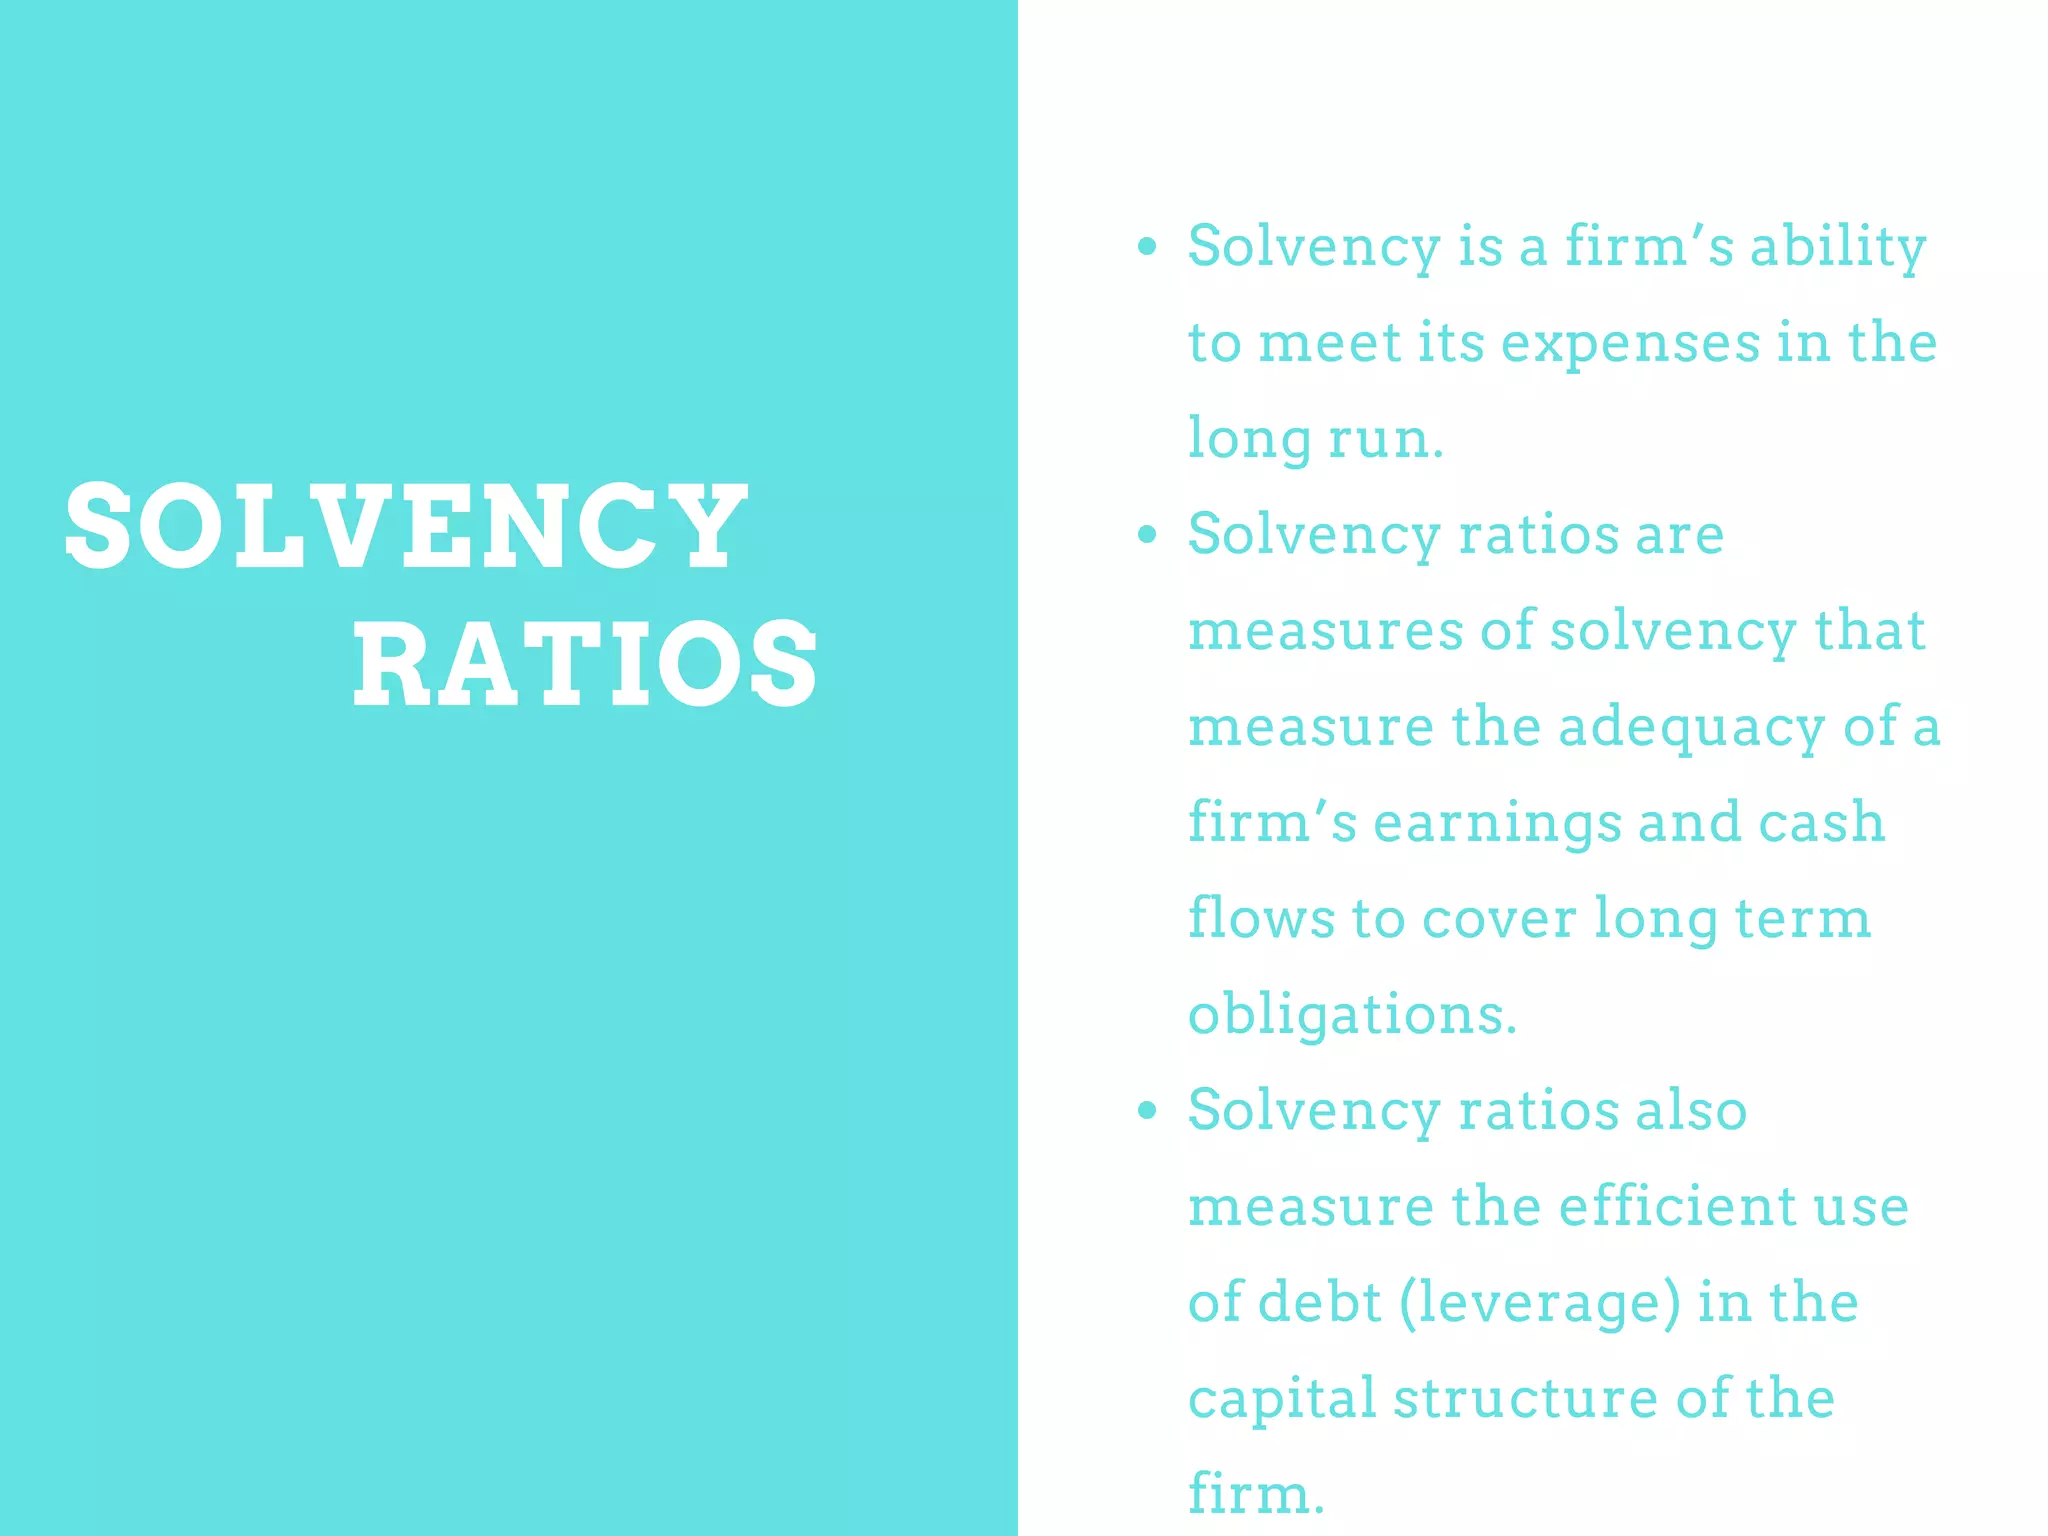
Solvency ratios, in essence, paint a picture of a company's long-term health. They focus on its ability to pay off its debts and other financial obligations in the long run. This is quite different from liquidity ratios, which measure the ability to meet short-term obligations.
Solvency Ratios: A Closer Look
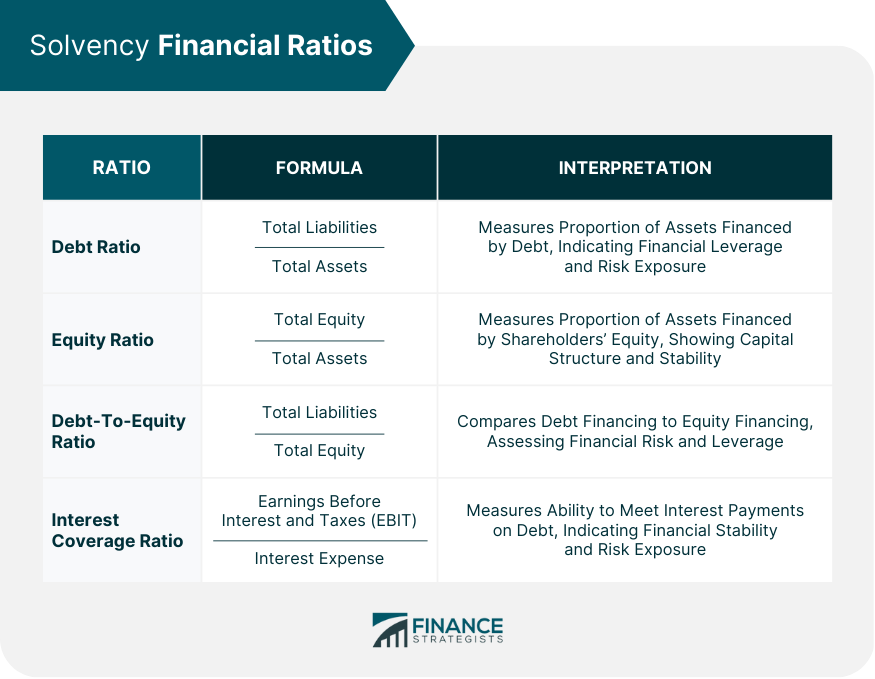
Several key ratios are considered true measures of solvency. These metrics provide critical insights into a company's financial structure and its capacity to handle long-term debt.
Debt-to-Assets Ratio
The Debt-to-Assets Ratio is a fundamental solvency indicator. It reveals the proportion of a company's assets that are financed by debt. A lower ratio generally indicates a more solvent company, as it implies a smaller reliance on borrowed funds.
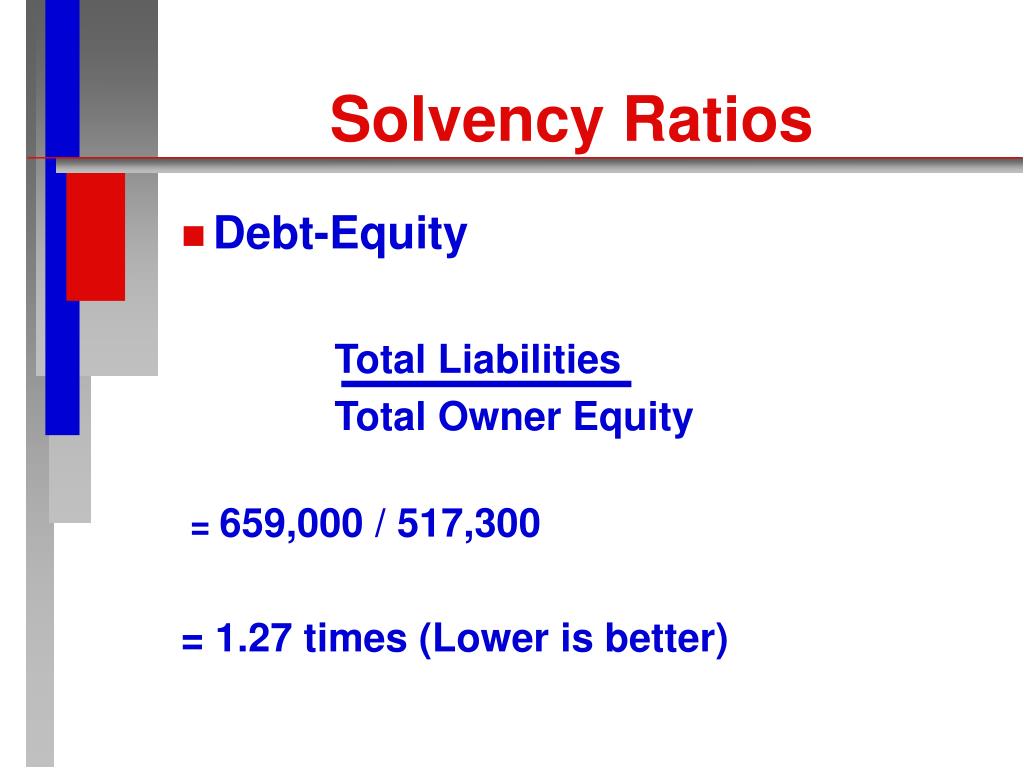
Debt-to-Equity Ratio
Another crucial metric is the Debt-to-Equity Ratio. This ratio compares a company's total debt to its shareholders' equity. A high ratio may suggest a higher risk of financial distress, as it indicates a greater reliance on debt financing compared to equity.
Times Interest Earned Ratio
The Times Interest Earned Ratio (TIE) assesses a company's ability to cover its interest expenses with its earnings before interest and taxes (EBIT). A higher TIE ratio demonstrates a stronger ability to meet its interest obligations, indicating greater solvency.
Equity Multiplier
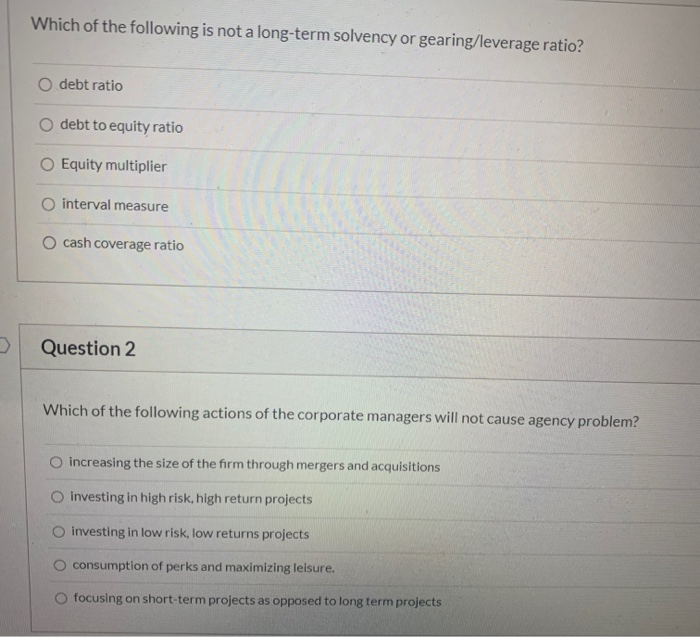
The Equity Multiplier, also known as the financial leverage ratio, measures the amount of a company's assets that are financed by equity. It's calculated by dividing total assets by total equity. This ratio highlights the extent to which a company uses debt to finance its assets; a higher multiplier indicates greater financial leverage and potentially higher risk.
The Imposter: Which Ratio Doesn't Belong?
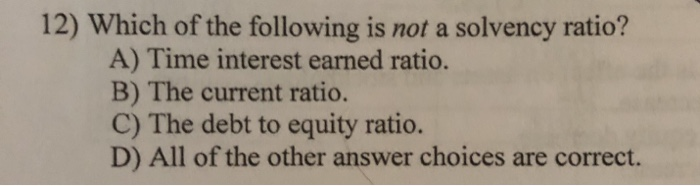
Now, let's address the core question: Which of the following is NOT a solvency ratio?
The answer is often found among liquidity ratios. A common example is the Current Ratio. While undeniably important, the Current Ratio falls firmly within the domain of liquidity, not solvency.
Understanding the Current Ratio
The Current Ratio measures a company's ability to pay off its short-term liabilities with its short-term assets. It's calculated by dividing current assets by current liabilities. A ratio of 1 or higher generally indicates that a company has enough liquid assets to cover its immediate obligations.
However, the Current Ratio does not reflect a company's long-term financial health. It focuses solely on the short-term, providing insight into a company's ability to meet its immediate financial needs, not its long-term debt obligations.
Consider a business with a high Current Ratio but also significant long-term debt. While it can easily pay its bills this month, it might struggle to meet its debt obligations over the next five years. This illustrates the crucial difference between liquidity and solvency.
Why This Matters: The Importance of Differentiation
Distinguishing between solvency and liquidity ratios is paramount for sound financial decision-making. Confusing the two can lead to inaccurate assessments of a company's financial stability.
Investors relying solely on liquidity ratios might overestimate a company's overall health. They may miss underlying solvency issues that could pose a significant threat in the long run. Similarly, business owners who neglect to monitor their solvency ratios might find themselves facing unexpected financial challenges down the line.
By accurately assessing both short-term liquidity and long-term solvency, stakeholders can gain a more comprehensive understanding of a company's financial position. This, in turn, allows for more informed investment decisions, better risk management strategies, and ultimately, greater financial stability.
The Bigger Picture: Beyond the Ratios
While solvency ratios are incredibly valuable tools, they are just one piece of the financial puzzle. It's essential to consider other factors when evaluating a company's financial health.
These factors include industry trends, economic conditions, and the company's management team. A holistic approach, combining quantitative analysis with qualitative insights, provides a more complete and nuanced understanding of a company's overall financial standing. Never rely on a single indicator, no matter how reliable, when assessing the stability of a company.
“Financial ratios are like vital signs for a business. They provide essential insights, but they must be interpreted within the context of the patient’s overall health and history.” - Anonymous Financial Analyst
Ultimately, understanding the difference between solvency and liquidity ratios, and applying them appropriately, is a critical skill for anyone involved in financial analysis. It's about more than just crunching numbers; it's about making informed decisions that lead to long-term financial success.


.jpg)