How To Create A Residual Plot On Ti 84
Unleash Your Inner Data Detective with Residual Plots!
Ready for some data sleuthing? Think of your TI-84 as your magnifying glass. We're about to uncover hidden secrets in your data! It's way more fun than it sounds, trust me.
Entering the Data Wonderland
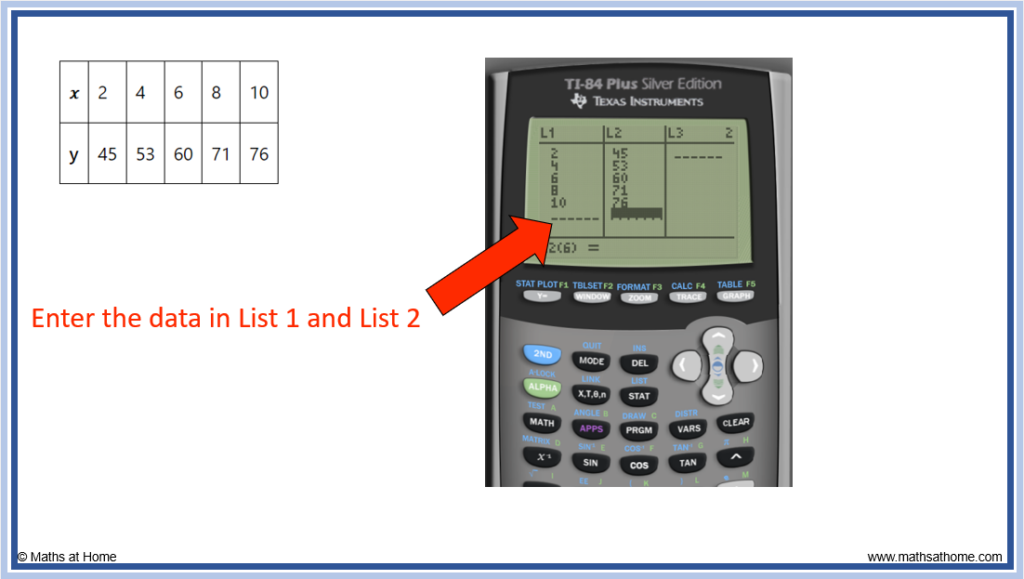
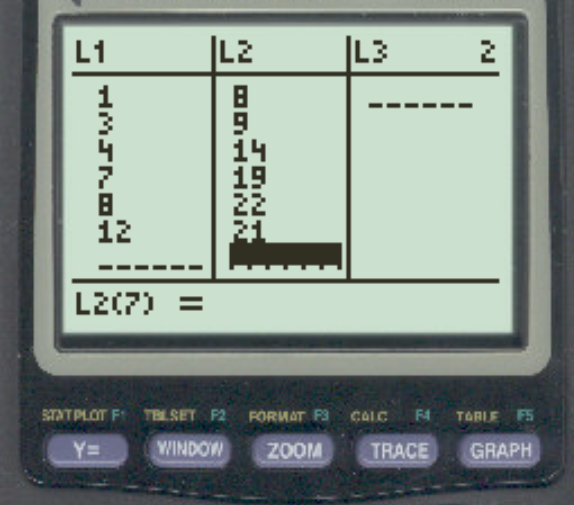
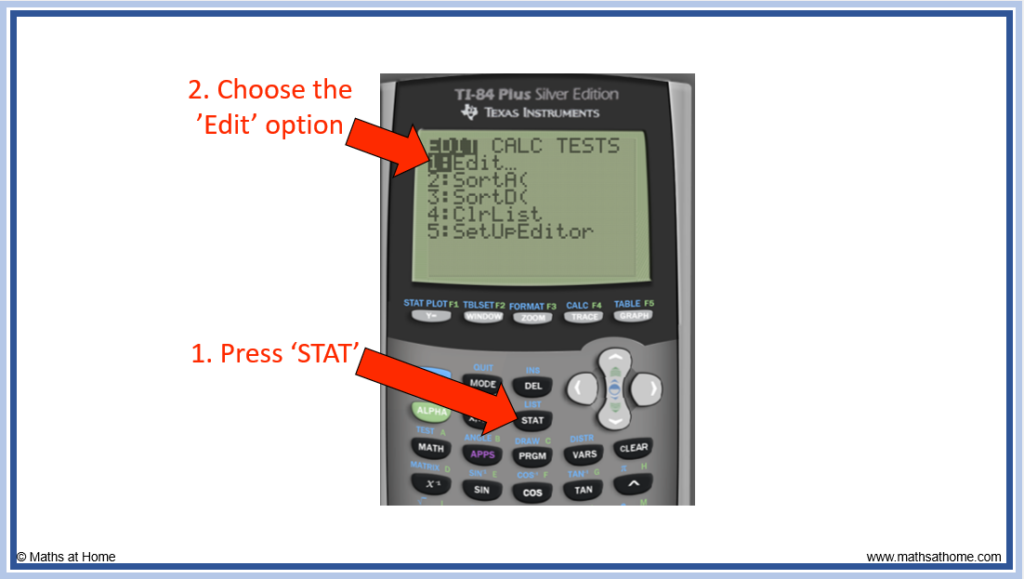
First things first, power up your TI-84. Find the "STAT" button. Press it like you mean it! Now, choose "EDIT" and enter your x-values in L1, and your y-values in L2.
Imagine L1 and L2 are two columns. One for what you're measuring, and one for the results. Think independent and dependent variables, or maybe just 'cause' and 'effect'.
Finding Your Line of Best Fit
Next, hit that "STAT" button again. This time, scroll over to "CALC." Select "LinReg(ax+b)". It's the key to unlocking the secrets! Then just tell the calculator where your x and y lists are (L1, L2).
This magical command finds the line that best fits your data. It's like finding the perfect partner for your data points. The calculator will give you the equation of the line. Cool, right?
Storing the Magic
Before we jump into plots, let's stash something important. Back in the "LinReg(ax+b)" screen, type a comma. Then hit "VARS," select "Y-VARS," choose "Function," and finally select Y1.
This is like putting your line of best fit formula into a special pocket. The TI-84 will remember it for later. This trick is crucial for seeing our residual plot come to life!
Plotting the Points
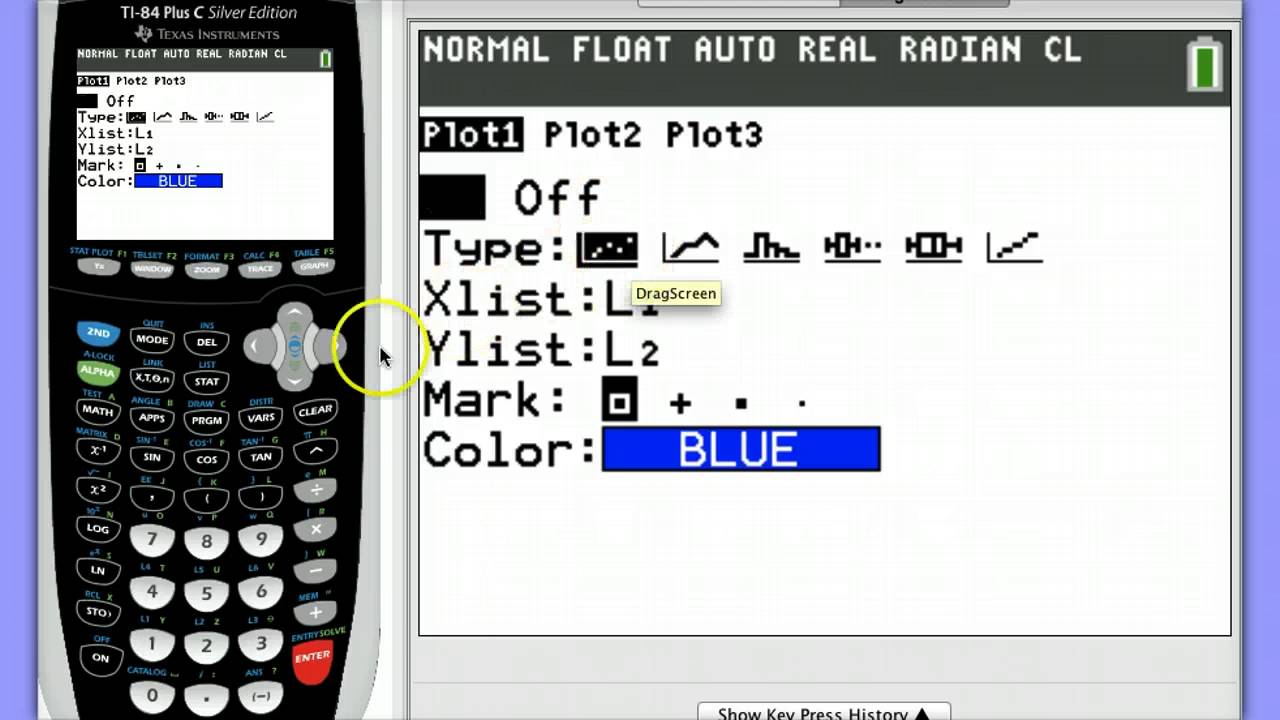
Now, let's create a scatterplot! Press "2nd" then "Y=" (STAT PLOT). Choose Plot1. Turn it "On." Make sure the type is set to a scatter plot (the first option). Tell it to use L1 for Xlist and L2 for Ylist.
This is like painting a picture of your raw data points. Each data point becomes a colorful dot on the canvas. You are the artist!
Creating the Residual Plot
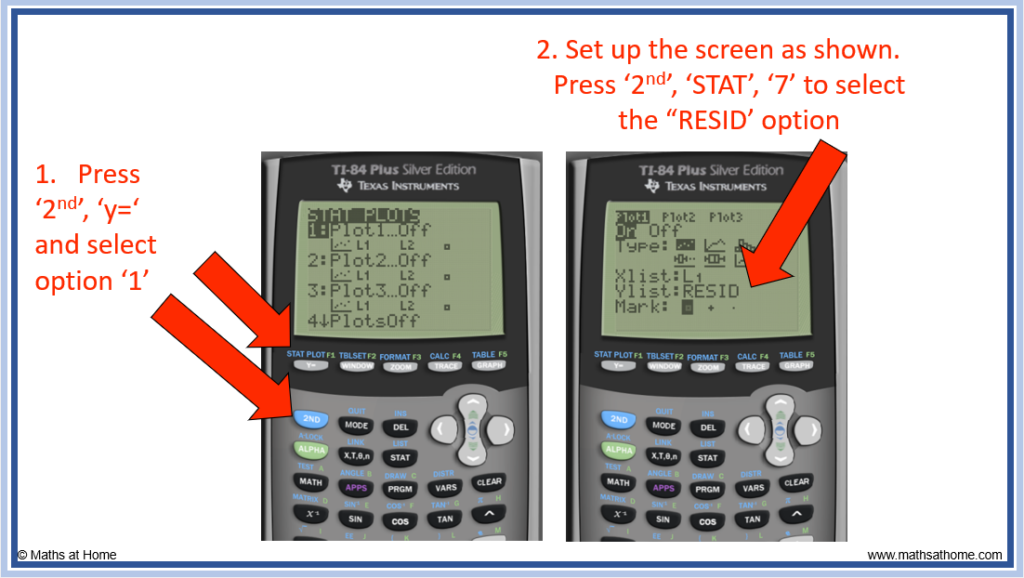
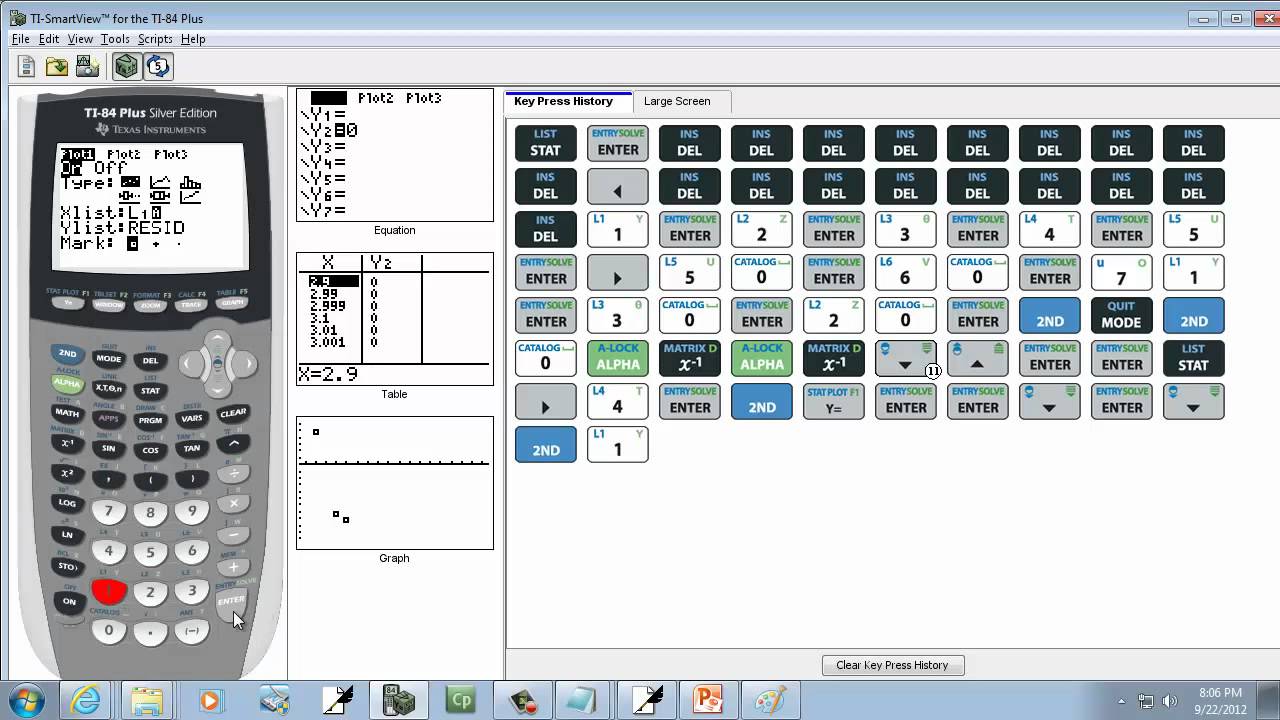
Here comes the grand finale! Go back to "2nd" then "Y=" (STAT PLOT). Pick another plot (like Plot2). Turn it "On." Select the scatter plot type, just like before. But this time, set Xlist to L1. This part is important!
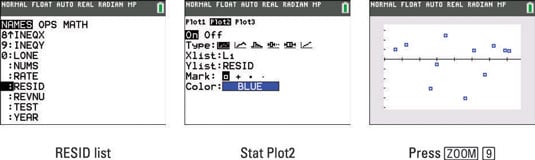
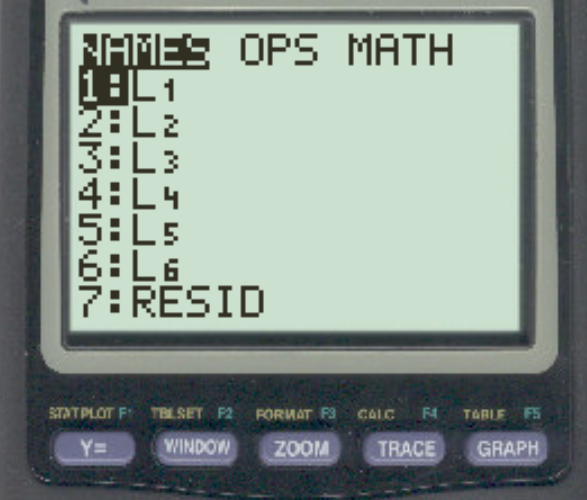
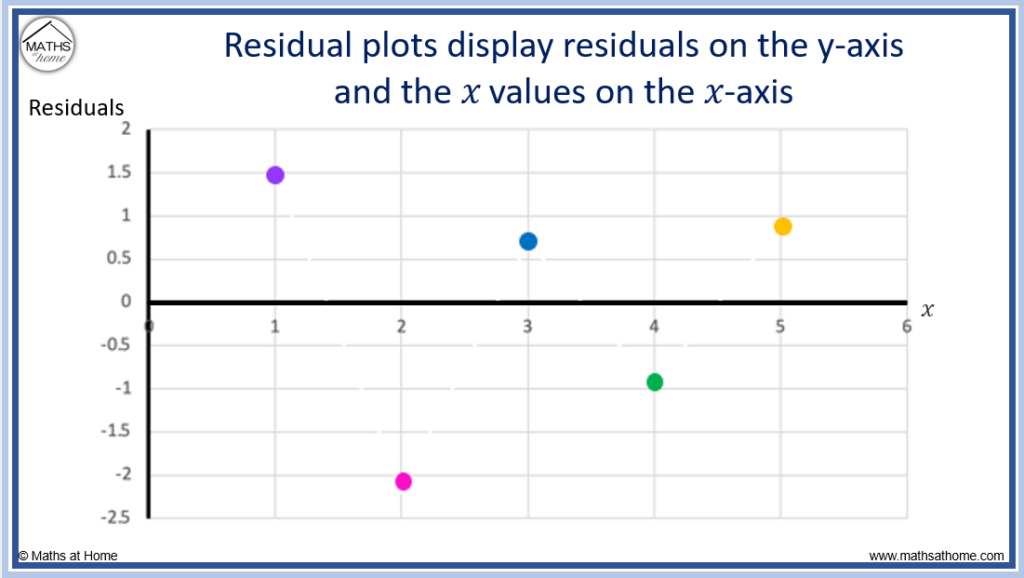
Now, for Ylist, hit "2nd" then "STAT" and scroll down until you find "RESID." Select it! This tells the TI-84 to plot the residuals on the y-axis.
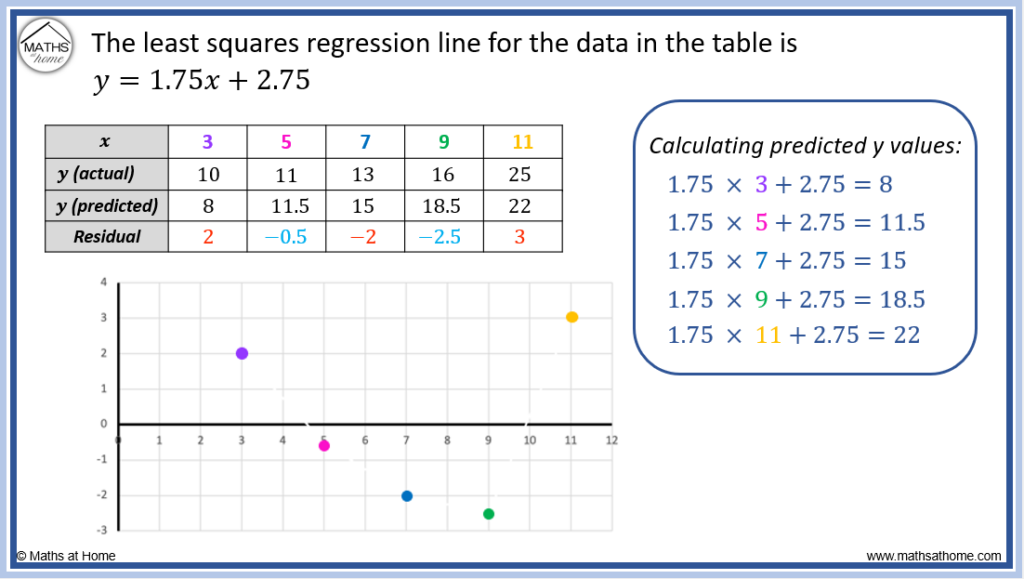
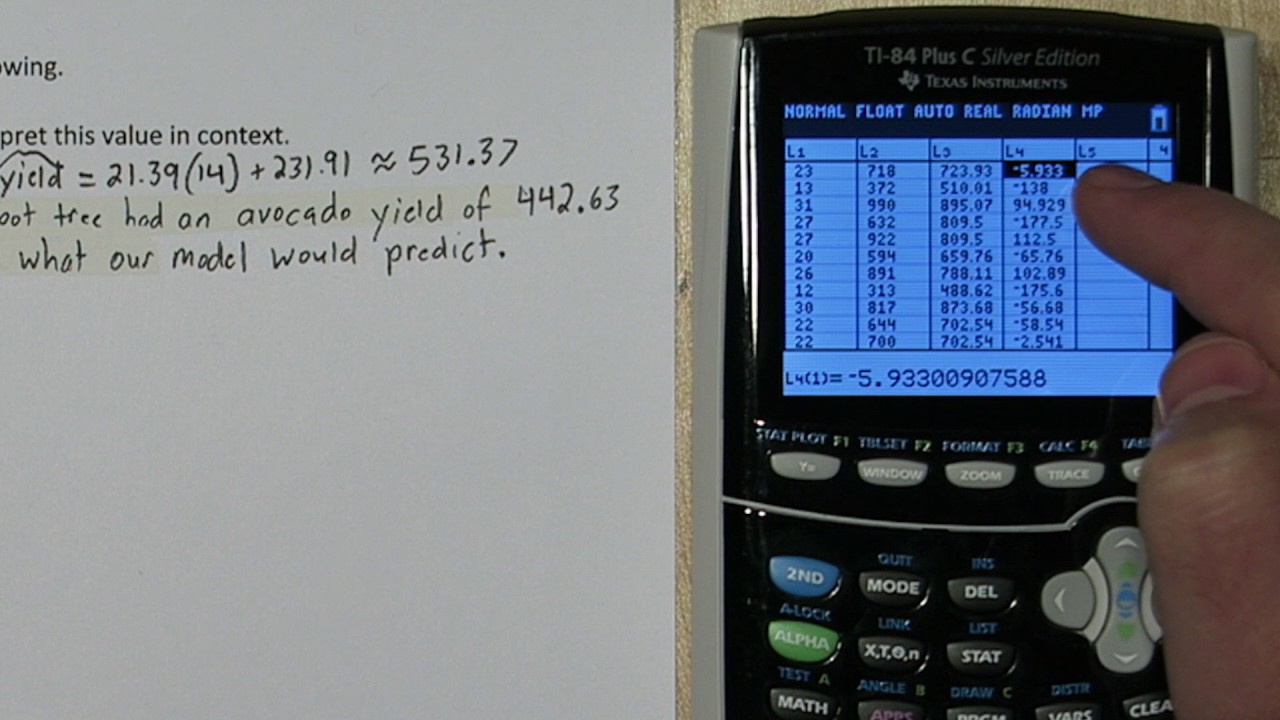
A residual is the difference between the actual data point and the value predicted by the line of best fit. It tells you how far off your line is from each actual data point.
Seeing the Pattern (or Lack Thereof)
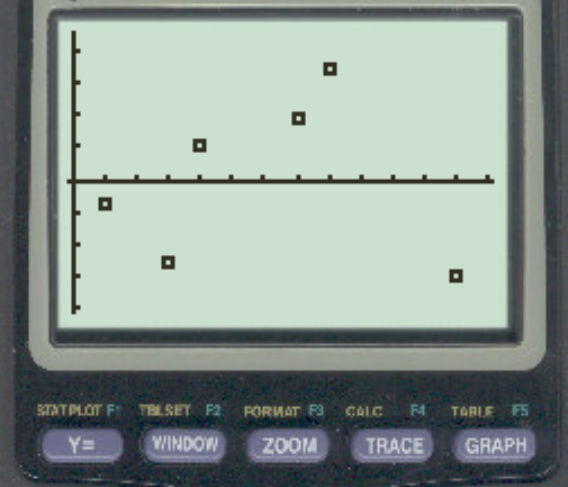
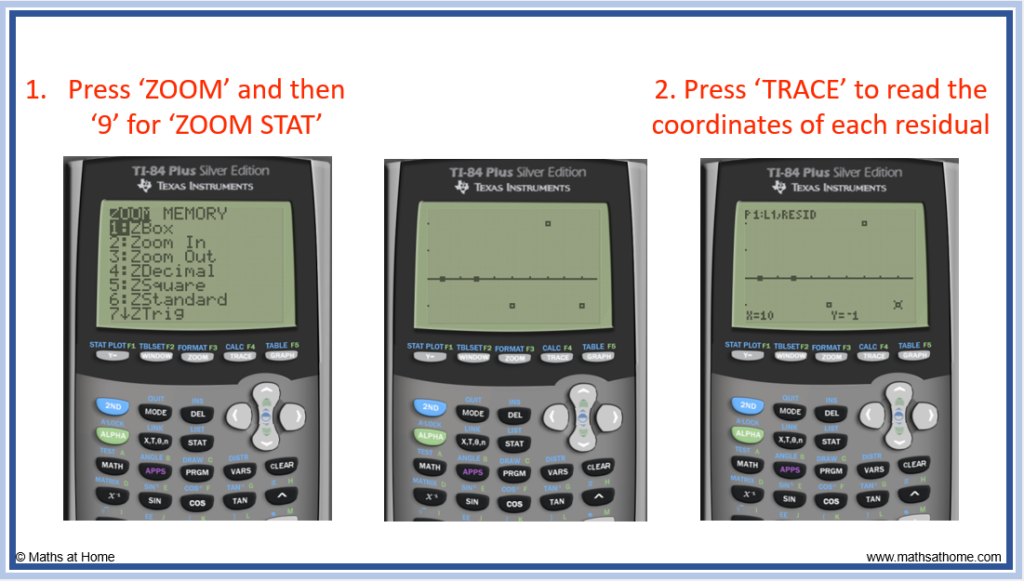
Almost there! Hit "ZOOM" then "9" (ZoomStat). This will perfectly scale your plots. Boom! You should see your original scatterplot AND your residual plot.
Take a good look at your residual plot. What do you see? Are the points randomly scattered? Or do you see a pattern?
What Does It All Mean?
A random scatter in the residual plot means your line fits the data well! No patterns are good news. A pattern, however, suggests that a linear model might not be the best choice for your data.
Think of it like this: a messy room (random scatter) is fine. But a carefully arranged pile of books (a pattern) suggests something's up! Congratulations, you've just decoded your data like a pro using the TI-84 and the magic of residual plots!
You have to learn the rules of the game. And then you have to play better than anyone else. –Albert Einstein