Best Trading Indicators For Swing Trading
Imagine yourself perched atop a digital mountain, the landscape of the stock market stretching before you. The sun glints off peaks of potential profit and casts long shadows of risk. You're a swing trader, a navigator of these short-term trends, and in your hands are the tools – the trading indicators – that will guide you to success. Choosing the right ones can feel like selecting the perfect compass for a challenging journey.
Swing trading, a strategy focused on capturing gains from short-term price swings over a few days or weeks, hinges on identifying emerging trends and potential reversal points. The best trading indicators for swing trading help traders achieve this by providing clear signals and confirming potential opportunities, boosting confidence and profitability.
Understanding Swing Trading
Swing trading is about capturing those mid-sized market moves that occur more frequently than long-term trends but are less frantic than day trading. It requires patience, discipline, and, crucially, a solid understanding of technical analysis. Technical analysis relies on studying past market data, primarily price and volume, to predict future price movements.
Indicators, mathematical calculations based on this data, are the swing trader's most valuable tools. They help filter out the noise and highlight potential entry and exit points. These indicators range from simple moving averages to more complex oscillators.
Key Swing Trading Indicators
Here are some of the most effective trading indicators for swing traders:
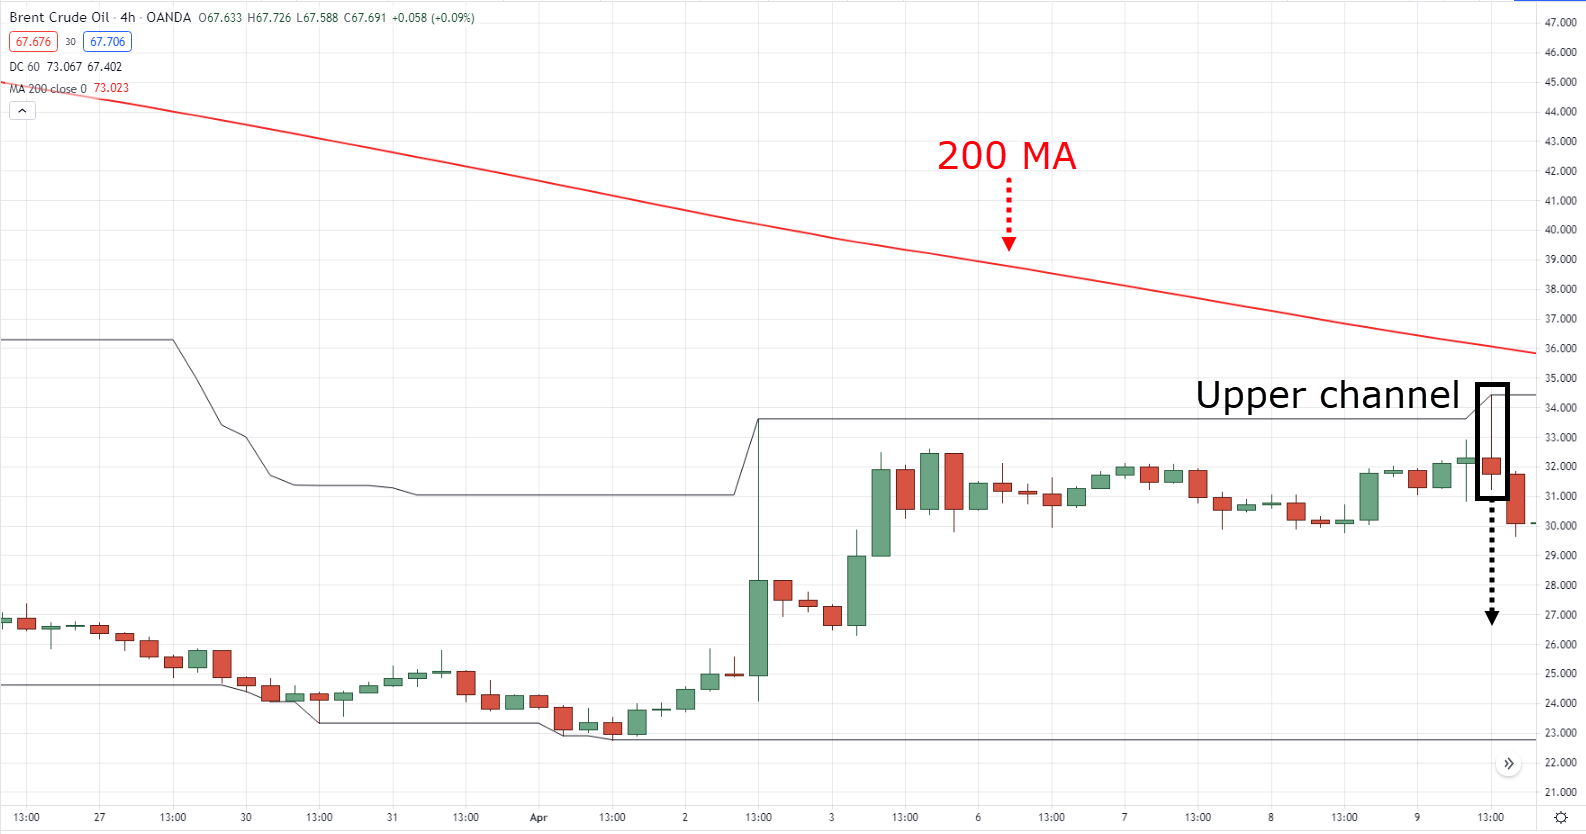
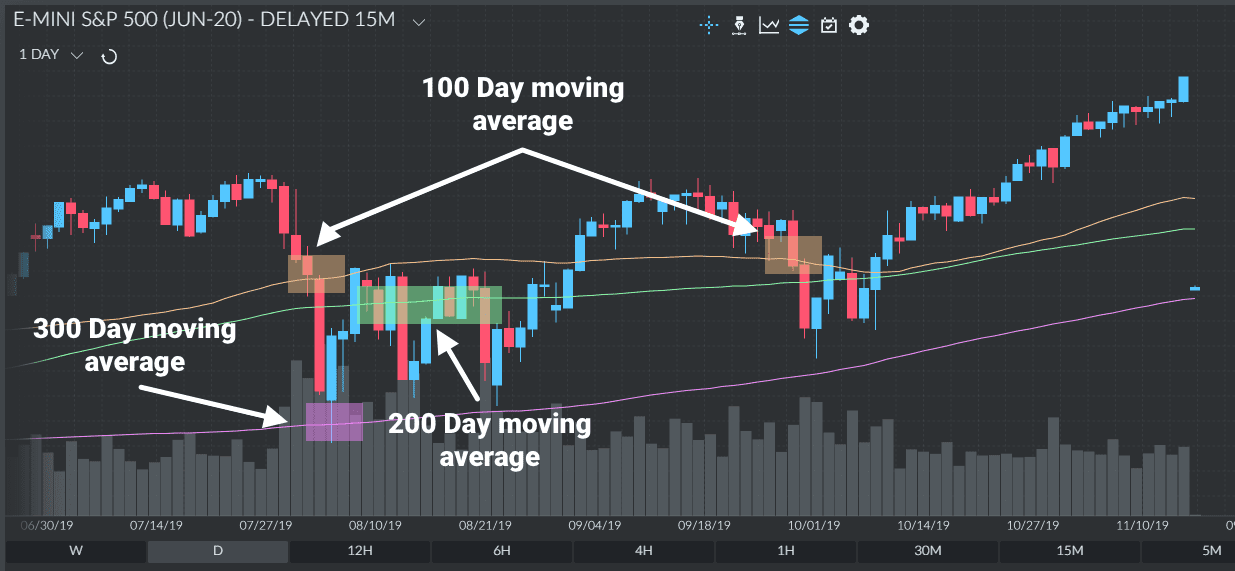
Moving Averages (MAs)
Moving Averages are among the simplest and most widely used indicators. They smooth out price data to create a single flowing line, making it easier to identify the direction of the trend. Swing traders often use exponential moving averages (EMAs), which give more weight to recent prices, making them more responsive to new information.
A popular strategy is to use two EMAs, a shorter-term (e.g., 20-day) and a longer-term (e.g., 50-day). A golden cross (shorter EMA crossing above the longer EMA) signals a potential buying opportunity, while a death cross (shorter EMA crossing below the longer EMA) suggests a selling opportunity.
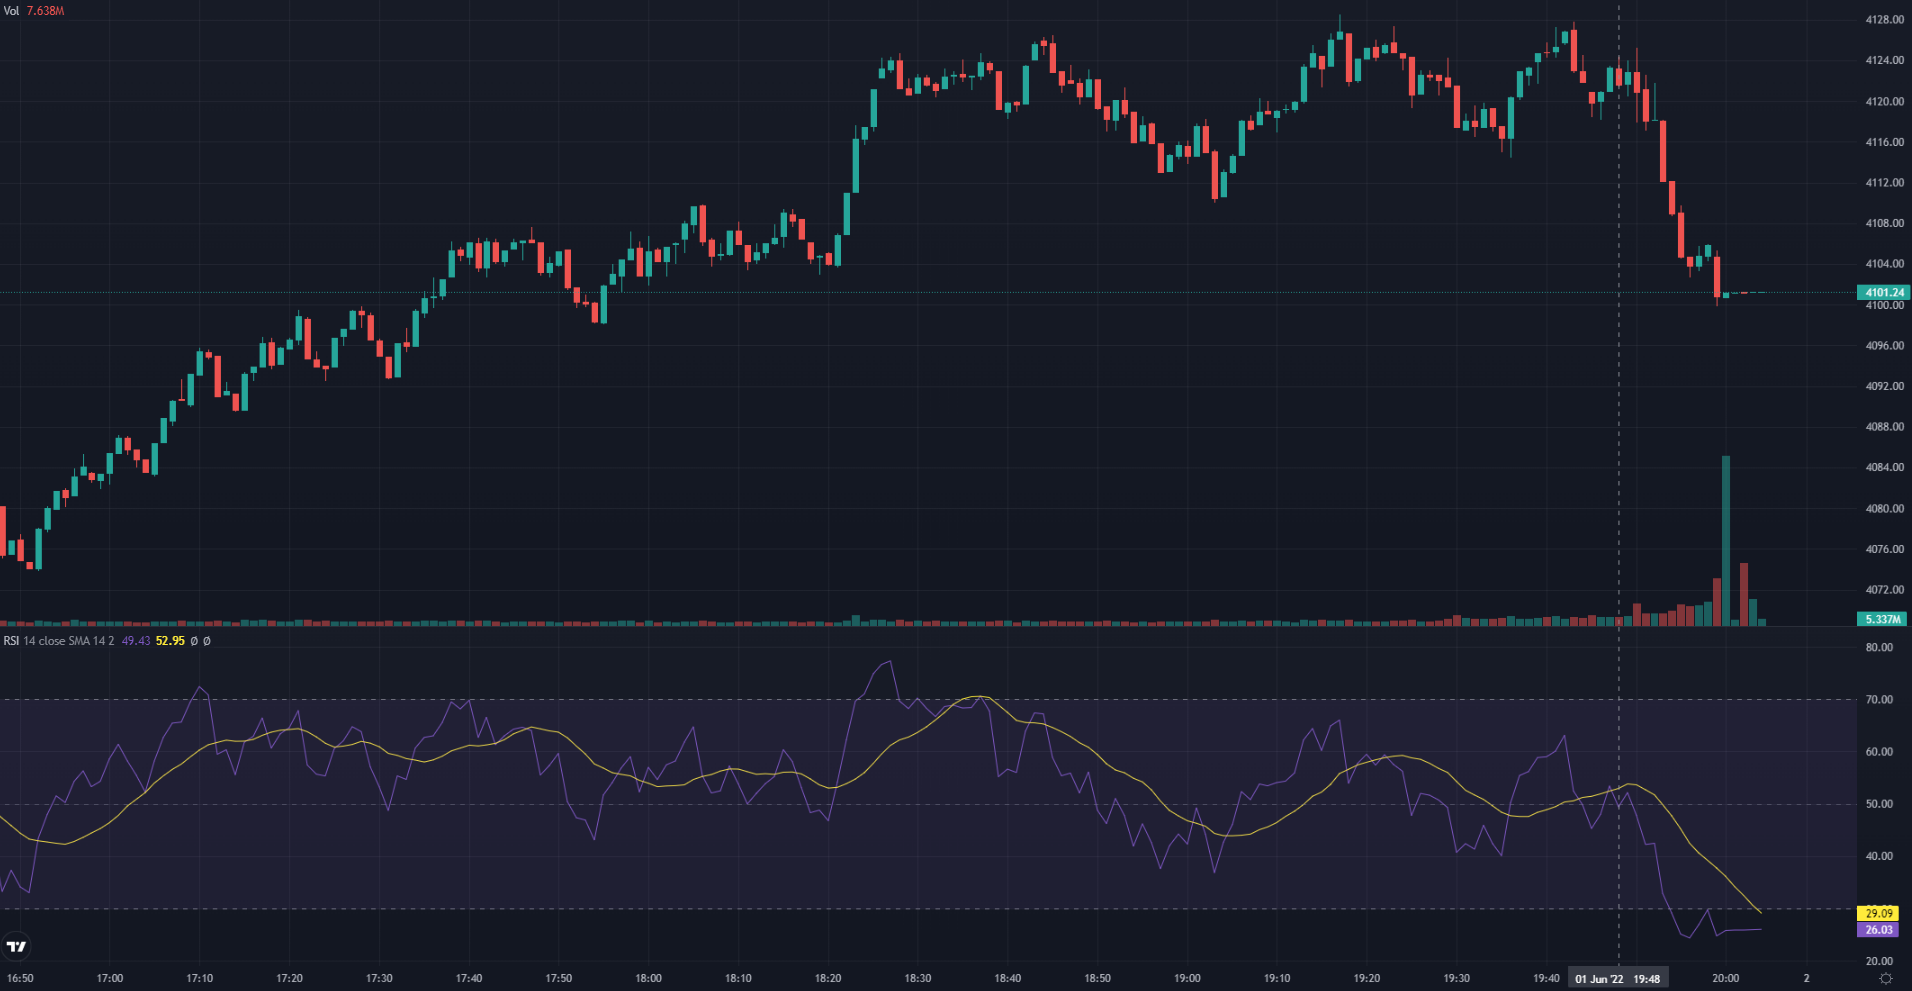
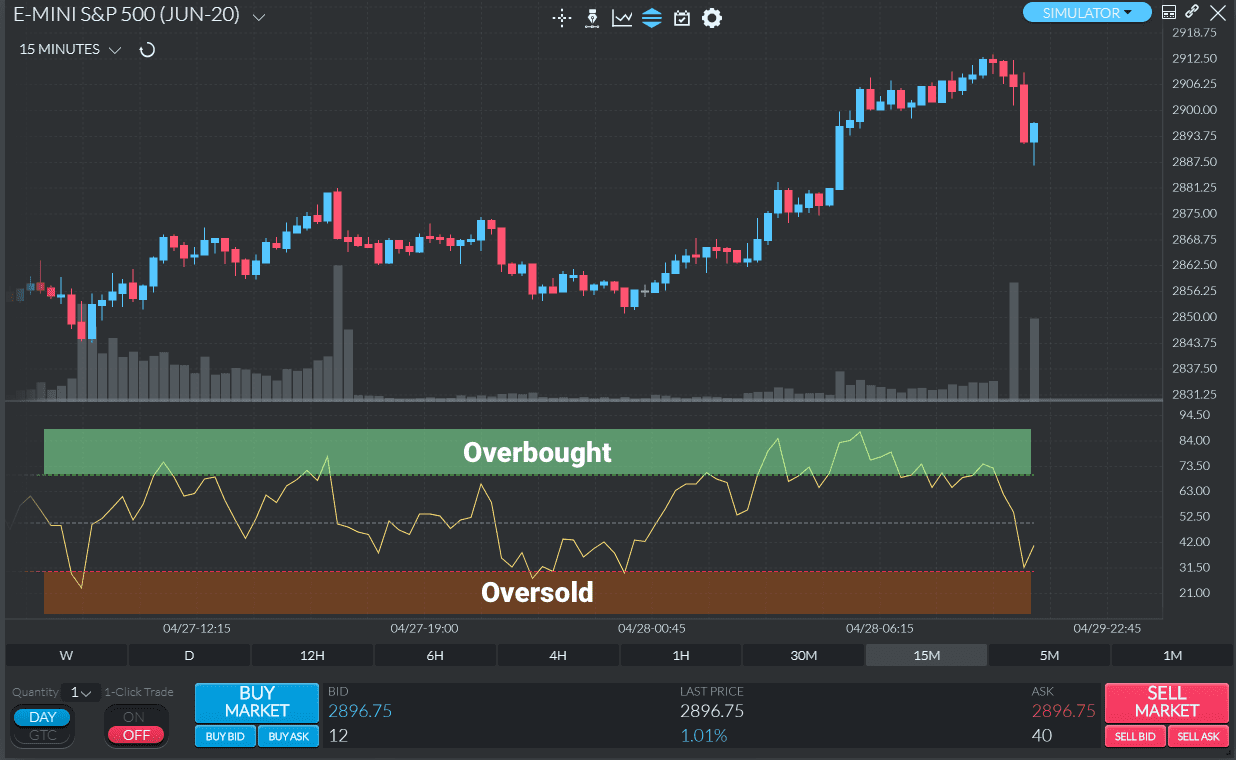
Relative Strength Index (RSI)
The RSI is a momentum oscillator that measures the magnitude of recent price changes to evaluate overbought or oversold conditions in the price of a stock or other asset. It oscillates between 0 and 100. Generally, an RSI above 70 indicates that an asset is overbought and may be due for a pullback, while an RSI below 30 suggests it is oversold and may be poised for a bounce.
Swing traders use RSI to identify potential entry and exit points based on these overbought and oversold levels. Divergence between the RSI and price action – for example, price making higher highs while the RSI makes lower highs – can also be a powerful signal of a potential trend reversal.
Moving Average Convergence Divergence (MACD)
The MACD is a trend-following momentum indicator that shows the relationship between two moving averages of a security’s price. It consists of the MACD line, the signal line, and a histogram that visually represents the difference between the two. Traders often use the MACD to identify potential buying opportunities when the MACD line crosses above the signal line, and selling opportunities when it crosses below.
The histogram can also provide valuable information. When it's above zero, it indicates that the MACD line is above the signal line, suggesting bullish momentum. Conversely, when it's below zero, it suggests bearish momentum.
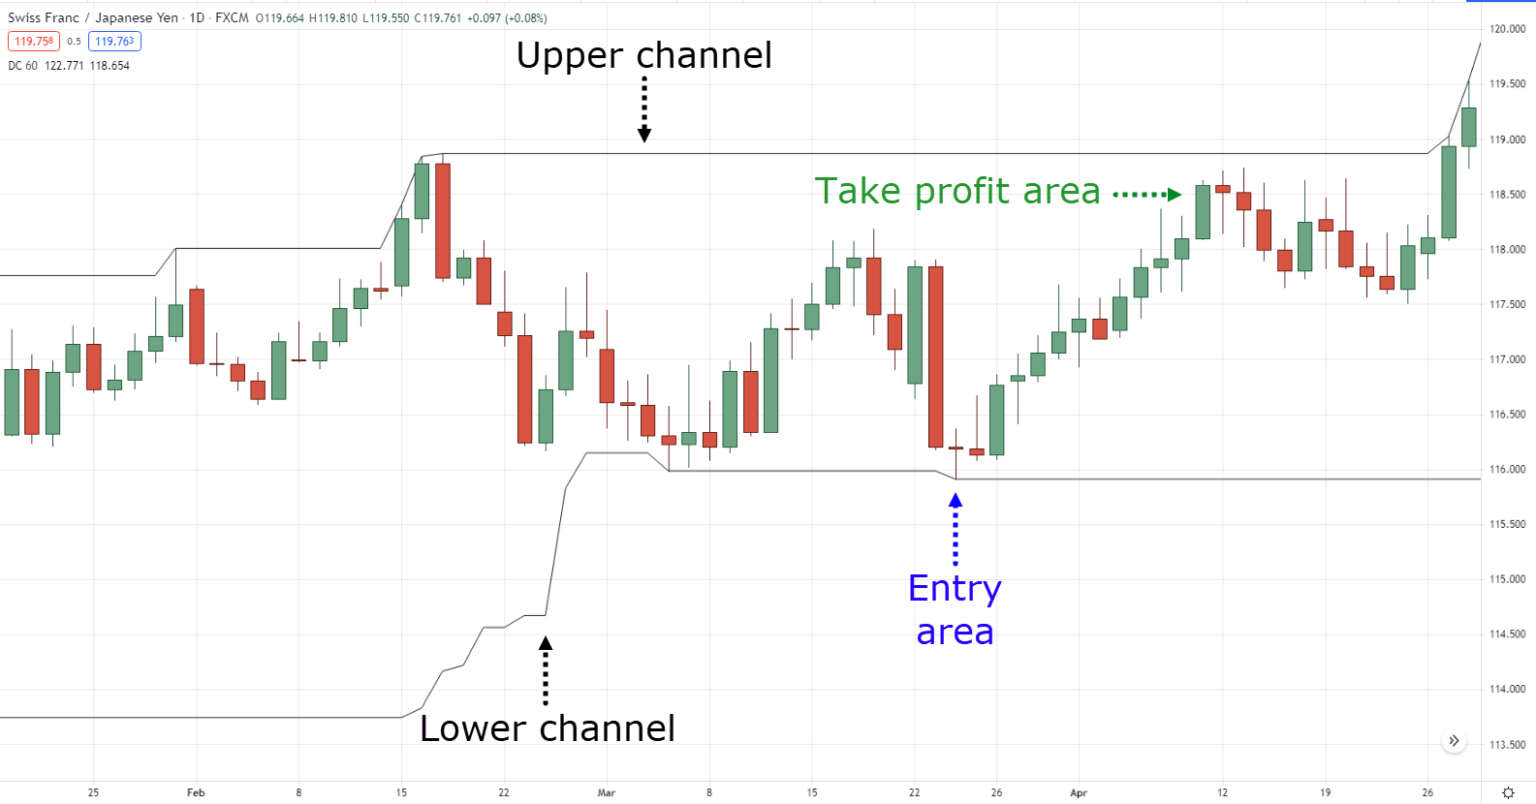
Fibonacci Retracement Levels
Based on the Fibonacci sequence, these levels are used to identify potential support and resistance areas. Swing traders use them to anticipate where a price might reverse direction. These levels are created by drawing horizontal lines at key Fibonacci ratios (23.6%, 38.2%, 50%, 61.8%, and 100%) based on the high and low points of a prior trend.
For example, if a stock has been in an uptrend and then begins to retrace, traders might look for buying opportunities at the 38.2% or 61.8% retracement levels. It's important to note that Fibonacci levels are not always precise, but they can be valuable areas to watch for potential price reactions.
Important Considerations
No indicator is foolproof. The best approach is to use a combination of indicators to confirm signals and reduce the risk of false positives. For example, a trader might use the RSI to identify an oversold condition and then wait for a bullish crossover on the MACD before entering a trade.
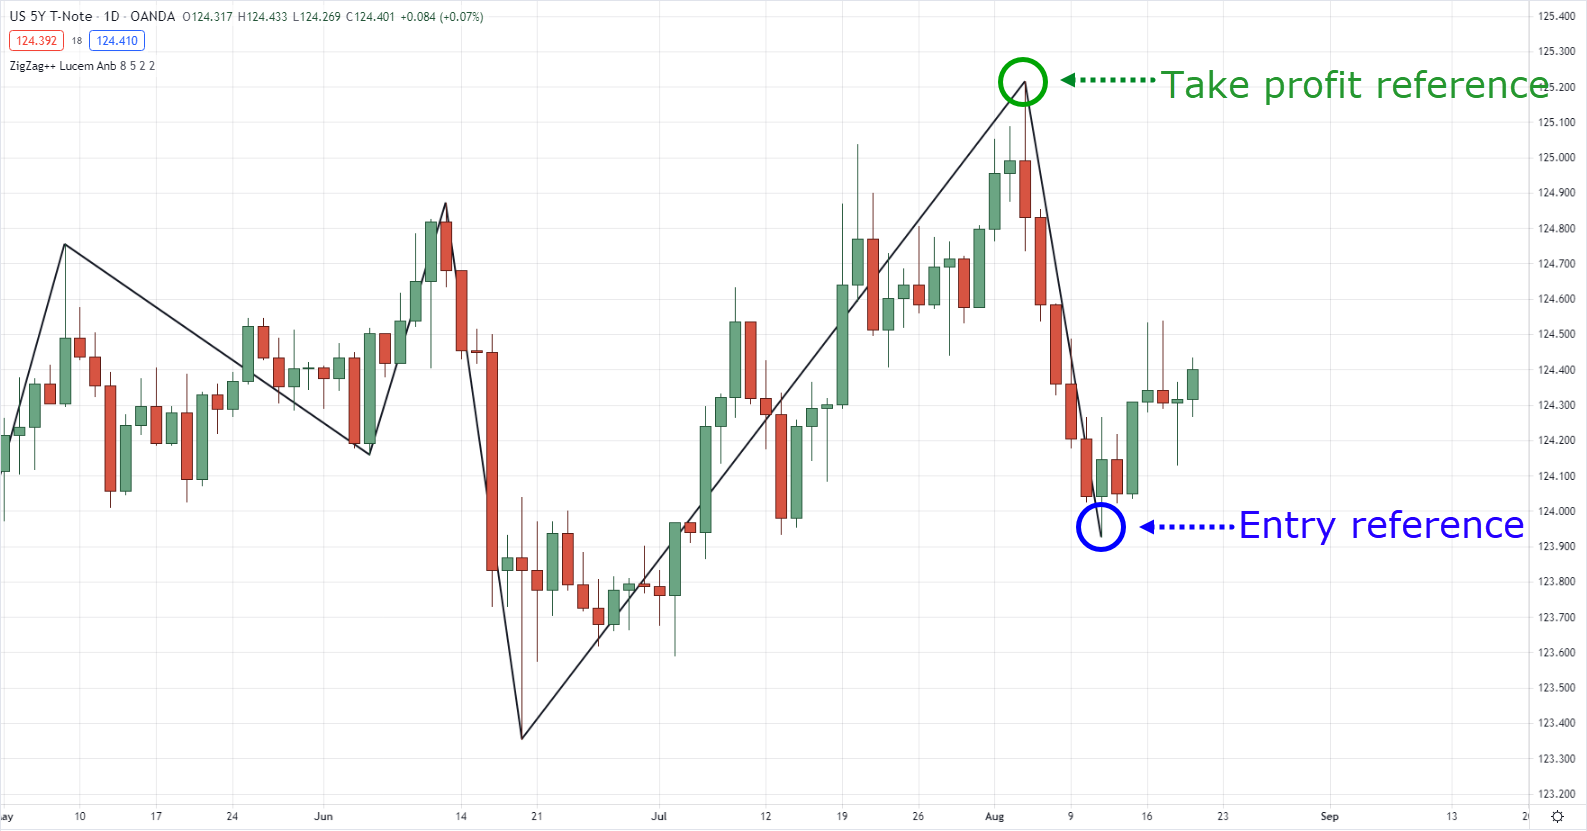
Risk management is also crucial. Always use stop-loss orders to limit potential losses and take-profit orders to lock in gains. Finally, remember that the market is constantly evolving, so it’s vital to test and adjust your strategies regularly.
Swing trading is a journey, not a destination. By mastering these powerful tools, maintaining discipline, and continuously learning, you can navigate the market's waves with greater confidence and potentially achieve your financial goals.

/dotdash_Final_Top_Technical_Indicators_for_Rookie_Traders_Sep_2020-01-65454aefbc9042ef98df266def257fa3.jpg?ssl=1)