Differentiate Between Population Density And Population Distribution

Confusion reigns as misinterpretations of population statistics threaten effective resource allocation. Understanding the critical difference between population density and population distribution is now more crucial than ever for accurate demographic analysis and informed policy decisions.
The terms are frequently conflated, leading to flawed conclusions about resource needs, infrastructure planning, and social service delivery. This article provides a clear and concise explanation of the distinct meanings and implications of each concept.
Population Density: A Measure of Crowding
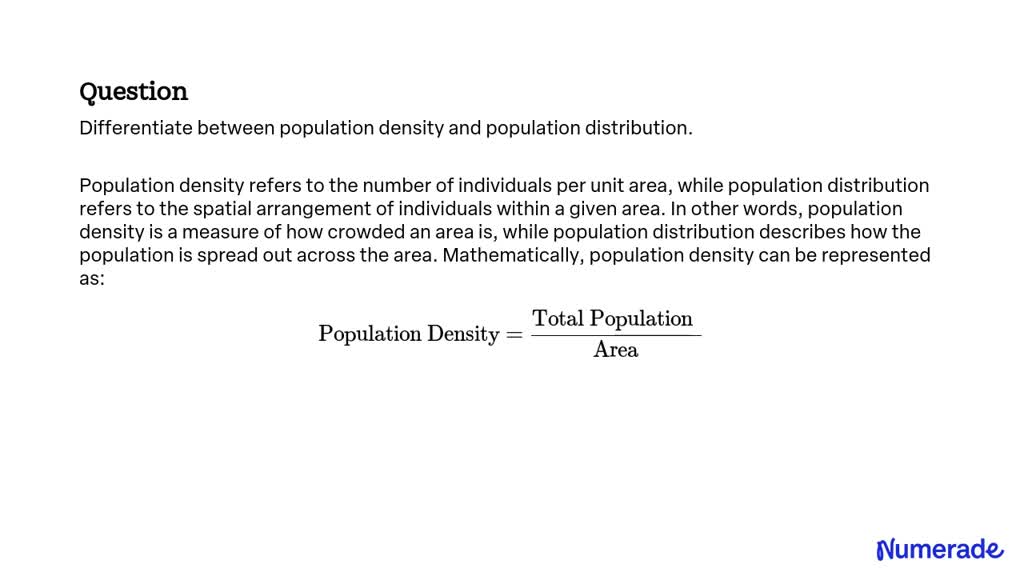
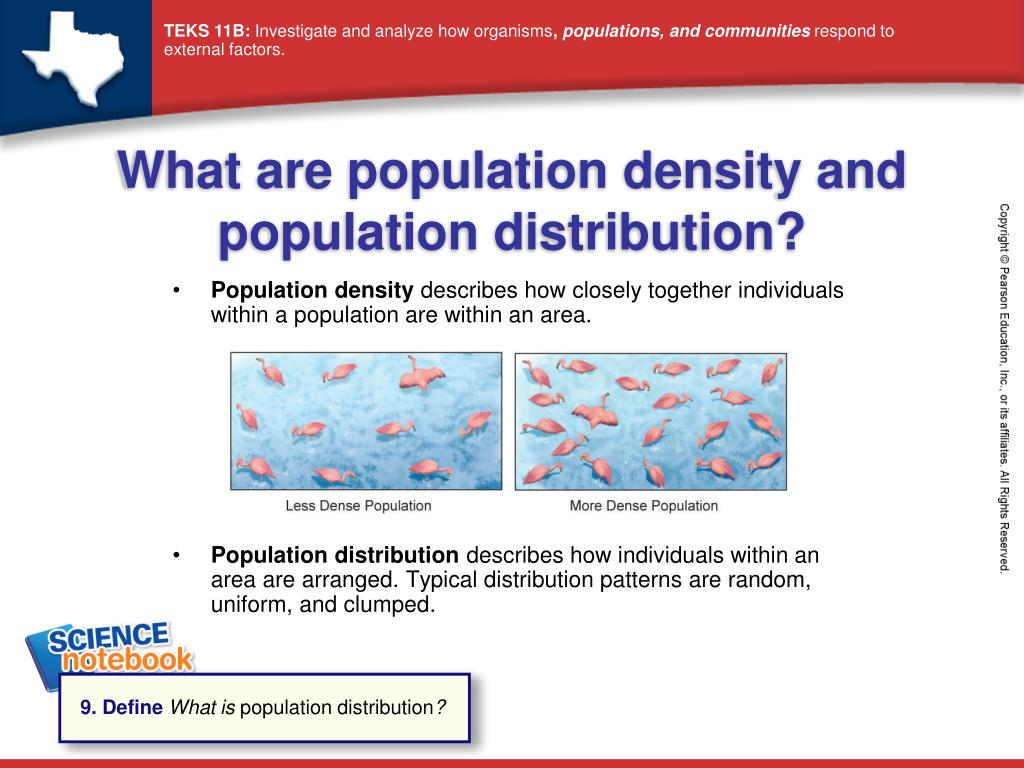
Population density is defined as the number of individuals living within a specific unit of area, typically expressed as people per square kilometer or square mile.
This metric focuses on how crowded a particular space is. The formula is simple: Population Density = Total Population / Land Area.
For example, according to the World Bank, Macau had a staggering population density of approximately 21,424 people per square kilometer in 2021.
Population Distribution: The Spatial Arrangement
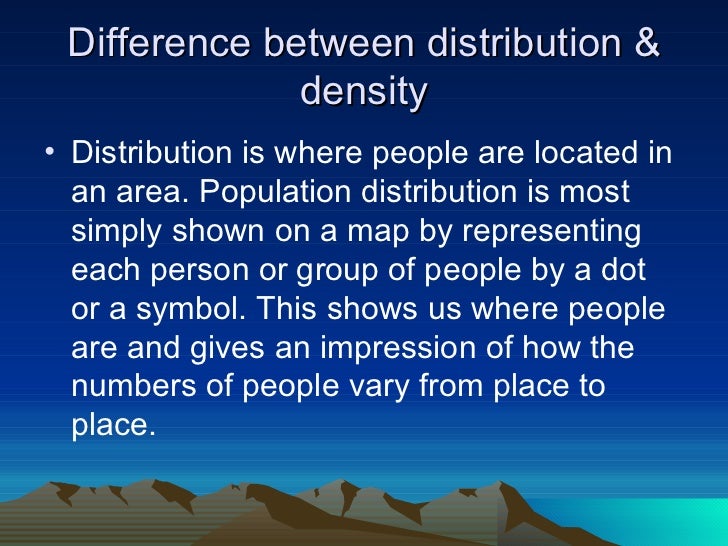
Population distribution, on the other hand, describes how people are spread out across a given area.
It is concerned with the pattern of human settlement and where people are located. This isn’t about the concentration, but the spread.
Data regarding population distribution is often visualized through maps illustrating clusters and sparse regions, highlighting patterns of urbanization and rural settlement.
Key Differences and Their Implications
Population density offers a single, summary statistic indicating crowding, while population distribution reveals the spatial arrangement of people. One is a number, the other a pattern.
A high population density doesn't necessarily imply uniform distribution. For instance, a country could have a high overall density, but most of its population might be concentrated in a few urban centers, leaving vast rural areas sparsely populated.
Conversely, a country with a low population density might still face challenges related to population distribution if its inhabitants are unevenly spread across geographically challenging terrains.
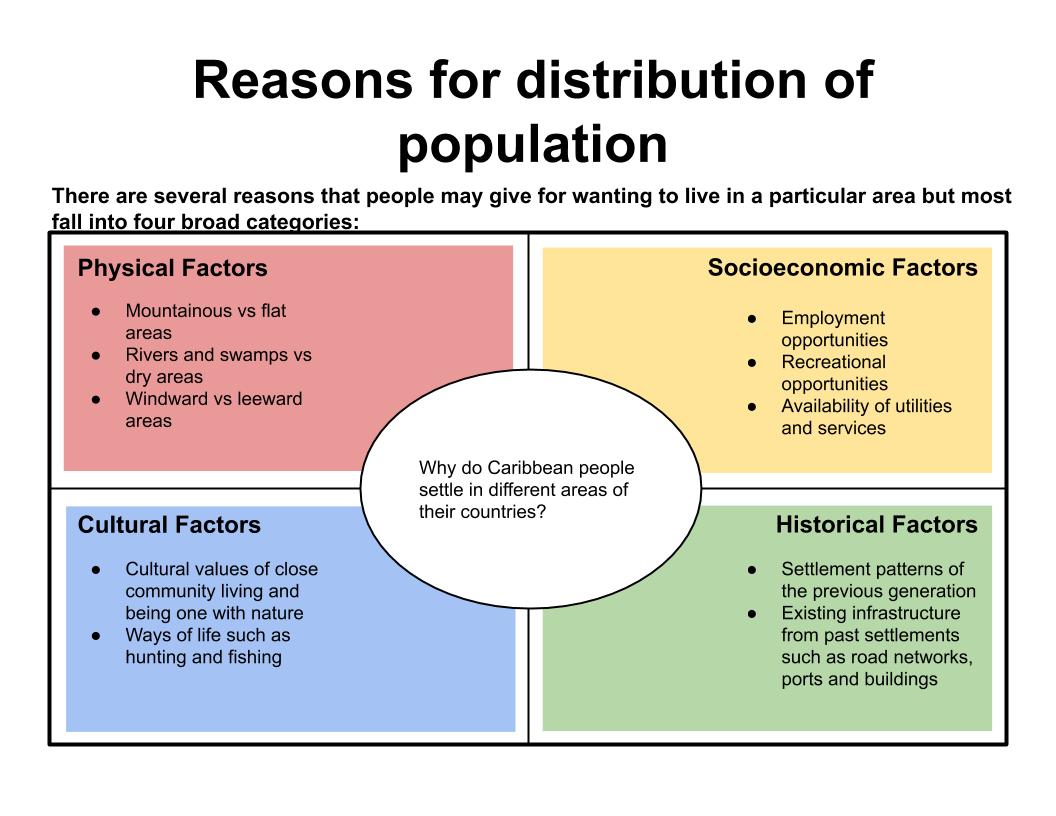
Case Studies Highlighting the Disparity
Consider Egypt: While the overall population density is moderate, the vast majority of Egyptians live along the Nile River, resulting in extremely high local densities and significant disparities in access to resources.
Canada, with its low population density overall, exhibits a strong concentration of people in the southern regions near the US border, leaving the vast northern territories sparsely inhabited.
These examples show that knowing *only* the density gives an incomplete picture.
Consequences of Misunderstanding
Confusing population density with population distribution can lead to misallocation of resources. If only density is considered, regions with dispersed populations but low densities might be overlooked, resulting in inadequate infrastructure and services.
Accurate analysis requires both metrics to ensure equitable resource allocation and effective planning. Imagine allocating medical supplies based solely on density; rural communities in dire need could be neglected.
Furthermore, misunderstanding can skew understanding of environmental impact, economic development, and social inequalities.
Data Sources and Ongoing Monitoring
Reliable population data is primarily sourced from national census bureaus, the United Nations Population Fund (UNFPA), and the World Bank.
These organizations provide comprehensive datasets on both population density and population distribution, enabling researchers and policymakers to conduct thorough analyses.
Ongoing monitoring and data updates are crucial to track demographic shifts and adapt strategies accordingly.
Next Steps: Promoting Clarity and Accurate Application
Increased efforts are needed to educate policymakers, urban planners, and the general public about the distinct meanings of population density and population distribution.
Workshops, educational materials, and accessible data visualizations can help promote a more nuanced understanding. These tools can help people understand how to differentiate both.
Moving forward, data analysis should prioritize the combined interpretation of both metrics to inform evidence-based decision-making and ensure equitable and sustainable development for all populations.