How To Measure Financial Performance Of A Business
In today's volatile economic landscape, understanding a business's true financial health is paramount. Misinterpreting financial data can lead to disastrous decisions, hindering growth, and even precipitating failure.
However, accurately gauging financial performance isn't merely about tracking revenue; it's a multifaceted process involving several key metrics and analytical techniques. This article delves into the essential methods for measuring a business's financial performance, offering insights for stakeholders at all levels.
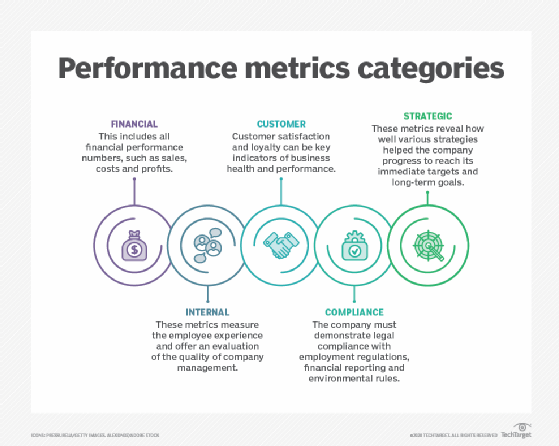
Key Performance Indicators (KPIs)
At the heart of financial performance measurement lie Key Performance Indicators (KPIs). These metrics provide a snapshot of various aspects of a company's financial well-being.
Choosing the right KPIs depends on the specific industry, business model, and strategic goals. However, some are universally applicable.
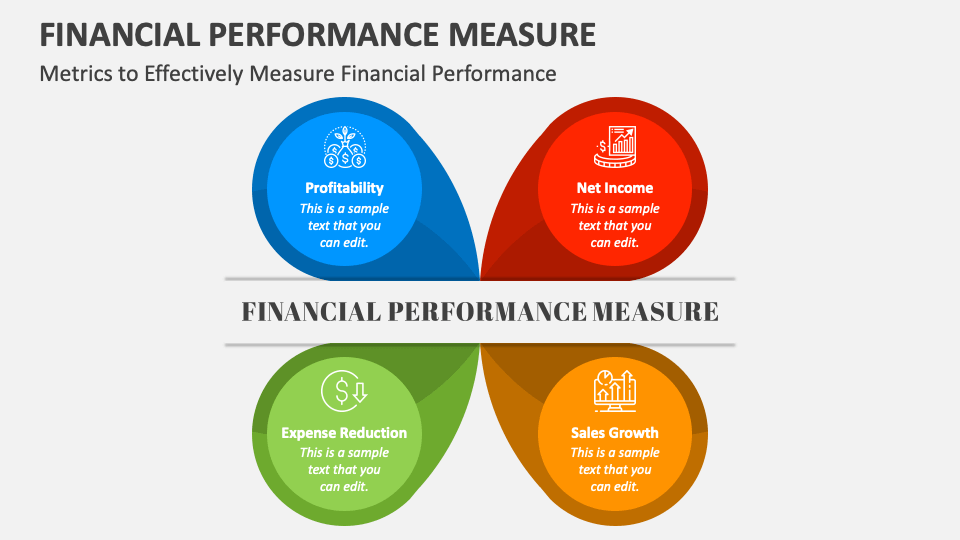
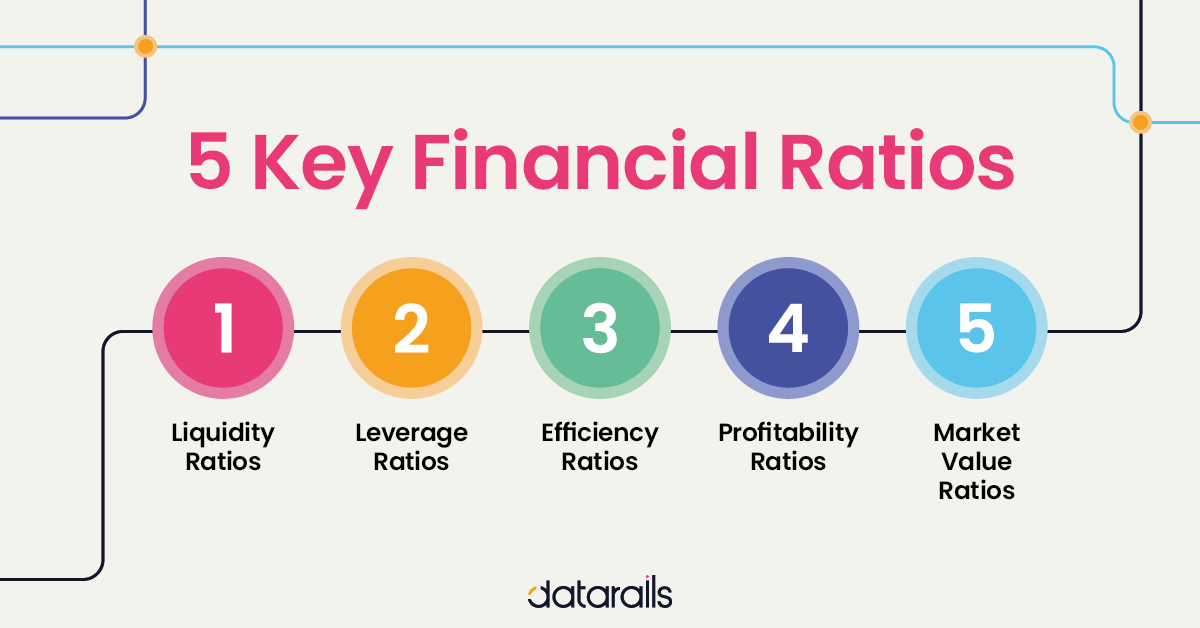
Profitability Ratios
Profitability ratios are fundamental for assessing a company's ability to generate earnings relative to its revenue, assets, and equity. The Gross Profit Margin, calculated as (Revenue - Cost of Goods Sold) / Revenue, indicates the profitability of a company's core operations.
A higher margin suggests greater efficiency in production and pricing. The Net Profit Margin, calculated as Net Income / Revenue, provides a more comprehensive view by factoring in all expenses.
According to Investopedia, a consistently improving net profit margin signifies enhanced financial health and operational effectiveness.
Liquidity Ratios
Liquidity ratios measure a company's ability to meet its short-term obligations. The Current Ratio, calculated as Current Assets / Current Liabilities, reveals whether a company has enough liquid assets to cover its immediate debts.
Generally, a ratio above 1 indicates sufficient liquidity. The Quick Ratio, or Acid-Test Ratio, is a more stringent measure, excluding inventory from current assets.
This provides a clearer picture of a company's ability to pay off short-term liabilities without relying on selling inventory.
Solvency Ratios
Solvency ratios assess a company's long-term financial stability and its ability to meet its long-term obligations. The Debt-to-Equity Ratio, calculated as Total Debt / Total Equity, indicates the proportion of debt financing compared to equity financing.
A high ratio suggests a greater reliance on debt, potentially increasing financial risk. The Times Interest Earned Ratio, calculated as Earnings Before Interest and Taxes (EBIT) / Interest Expense, measures a company's ability to cover its interest payments with its operating income.
Efficiency Ratios
Efficiency ratios evaluate how effectively a company is using its assets and resources. The Inventory Turnover Ratio, calculated as Cost of Goods Sold / Average Inventory, measures how quickly a company sells its inventory.
A higher turnover rate suggests efficient inventory management. The Asset Turnover Ratio, calculated as Revenue / Total Assets, measures how effectively a company generates revenue from its assets.
A higher ratio implies better asset utilization. Deloitte emphasizes the importance of benchmarking efficiency ratios against industry averages to identify areas for improvement.
Financial Statement Analysis
Analyzing financial statements is crucial for a holistic understanding of a company's financial performance. This involves scrutinizing the Income Statement, Balance Sheet, and Cash Flow Statement.
The Income Statement reveals a company's revenues, expenses, and profits over a period. The Balance Sheet provides a snapshot of a company's assets, liabilities, and equity at a specific point in time.
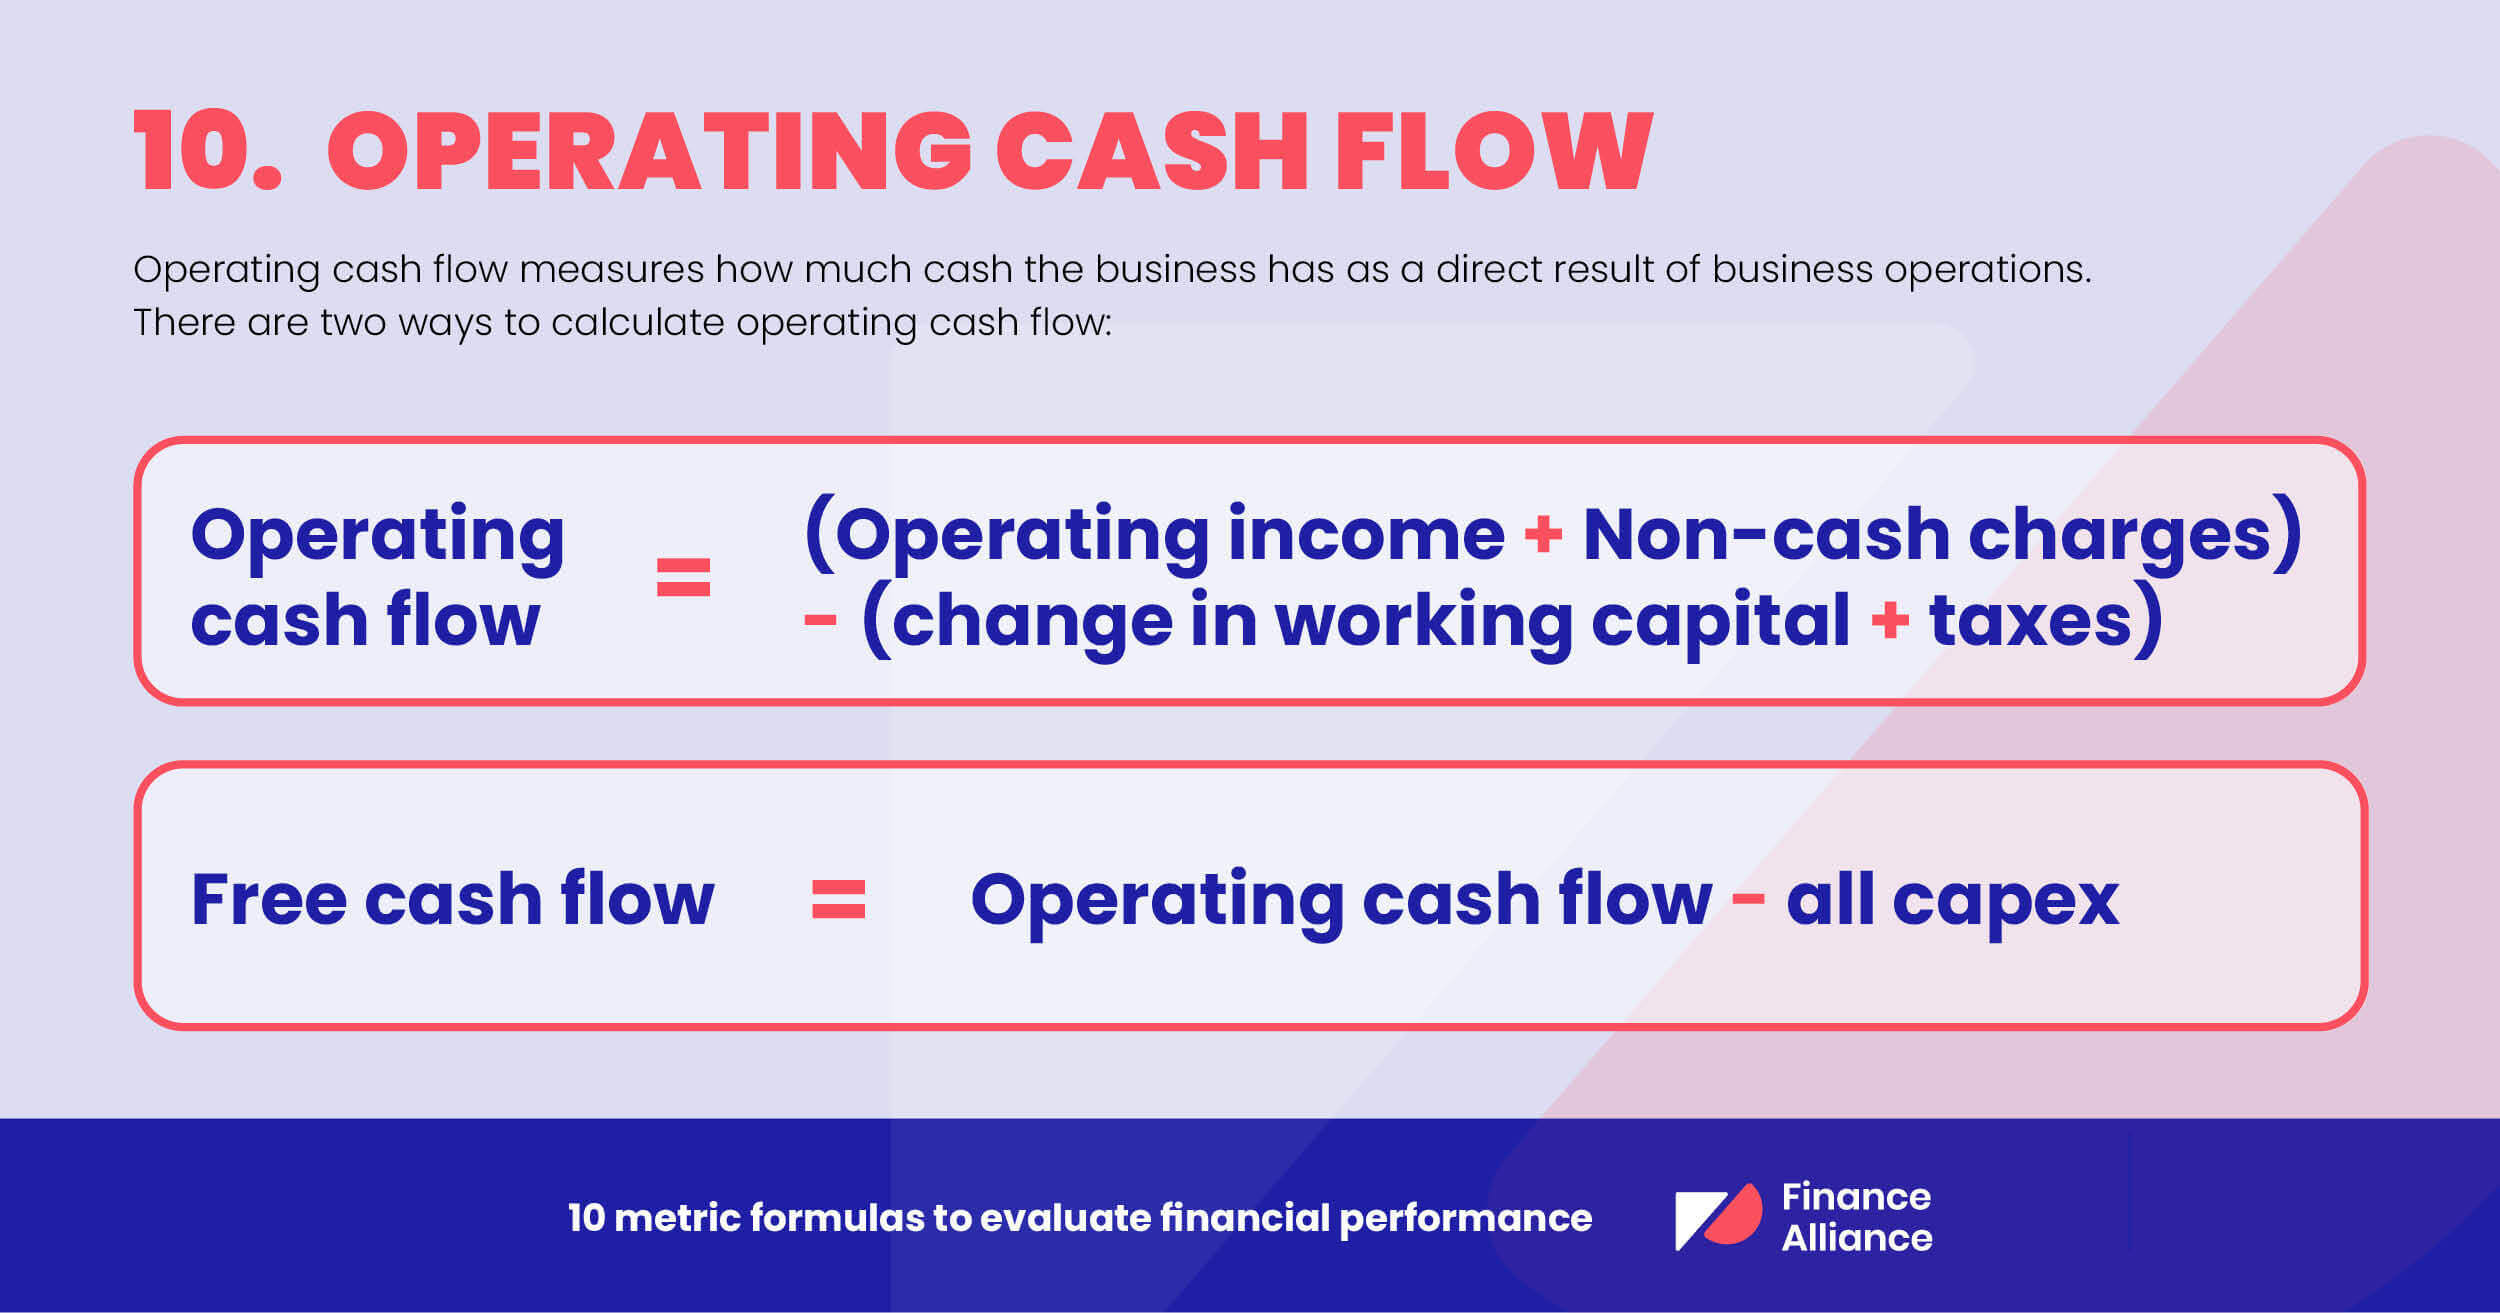
The Cash Flow Statement tracks the movement of cash both into and out of a company, categorizing activities as operating, investing, or financing.
Benchmarking and Trend Analysis
Benchmarking involves comparing a company's financial performance against its competitors or industry averages. This helps identify areas where the company is excelling or lagging behind.
Trend analysis involves examining financial data over time to identify patterns and trends. This can reveal whether a company's financial performance is improving or deteriorating, and help predict future performance.
According to a report by PwC, incorporating both benchmarking and trend analysis provides a more robust assessment of financial health.
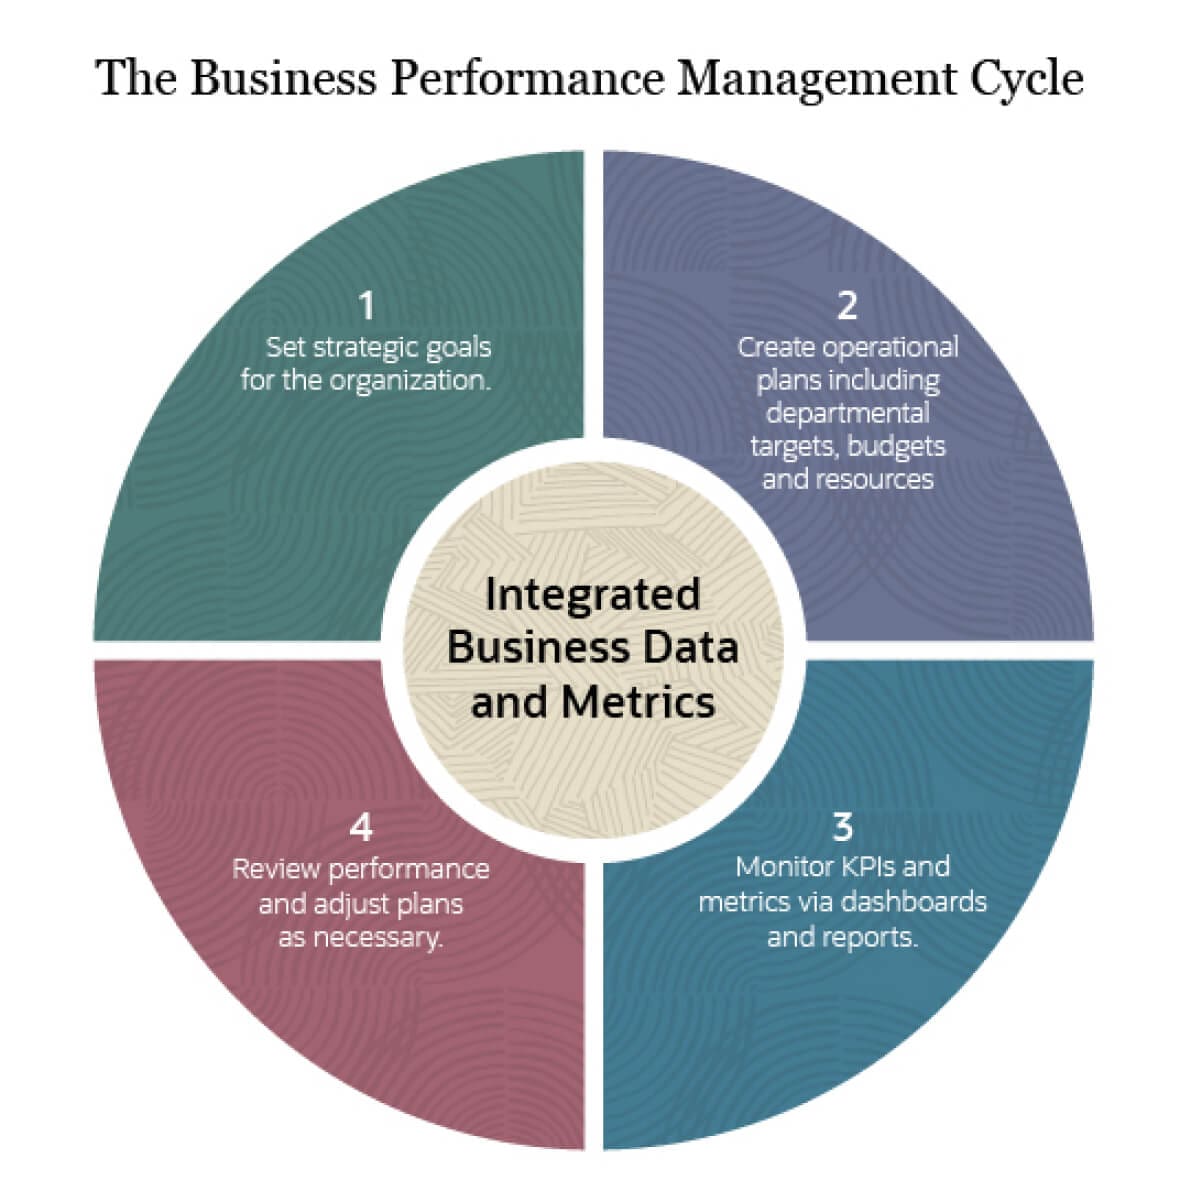
Looking Ahead
Measuring financial performance is not a one-time event but an ongoing process. By regularly monitoring KPIs, analyzing financial statements, and conducting benchmarking and trend analysis, businesses can gain valuable insights into their financial health and make informed decisions.
Technological advancements, such as sophisticated data analytics platforms, are increasingly playing a vital role in streamlining this process, providing real-time insights and predictive capabilities.
As the business environment continues to evolve, a proactive and data-driven approach to financial performance measurement will be critical for long-term success.


:max_bytes(150000):strip_icc()/Financial-performance-4196424-Final-240df17e57f54106b5a92680ff2465ee.jpg)