The Location Of The Product Supply Curve Depends On
Imagine strolling through a bustling farmer's market on a sunny Saturday morning. The air is filled with the aroma of freshly baked bread, ripe fruits, and blooming flowers. Each vendor proudly displays their goods, with prices varying depending on the season, the weather, and the sheer effort put into bringing those products to market. This lively scene is a microcosm of the broader economic forces that determine the supply curve, a fundamental concept that dictates how much producers are willing to offer at various prices.
At the heart of understanding market dynamics lies a critical question: What exactly dictates where the product supply curve sits on the graph? It's not just about pricing strategies; the supply curve's position is influenced by a complex interplay of factors ranging from production costs to technological advancements and even government regulations. Unraveling these determinants provides invaluable insights into how businesses operate and how markets respond to change.
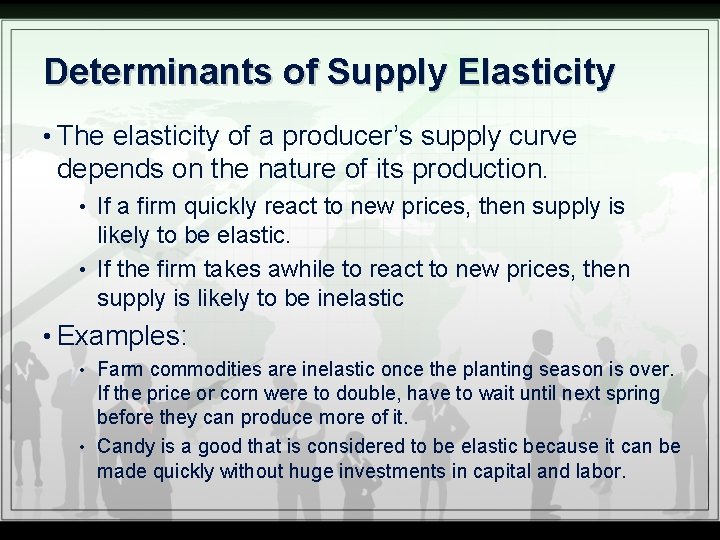
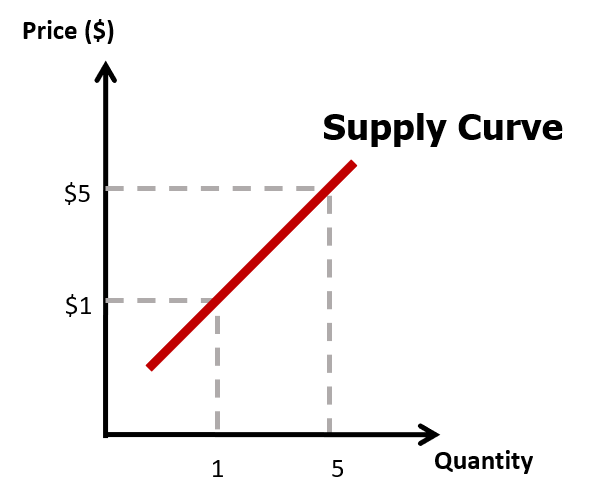
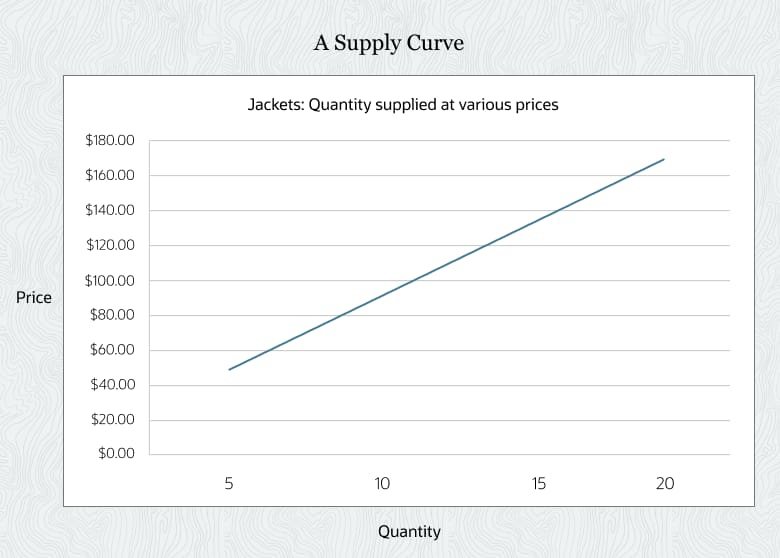
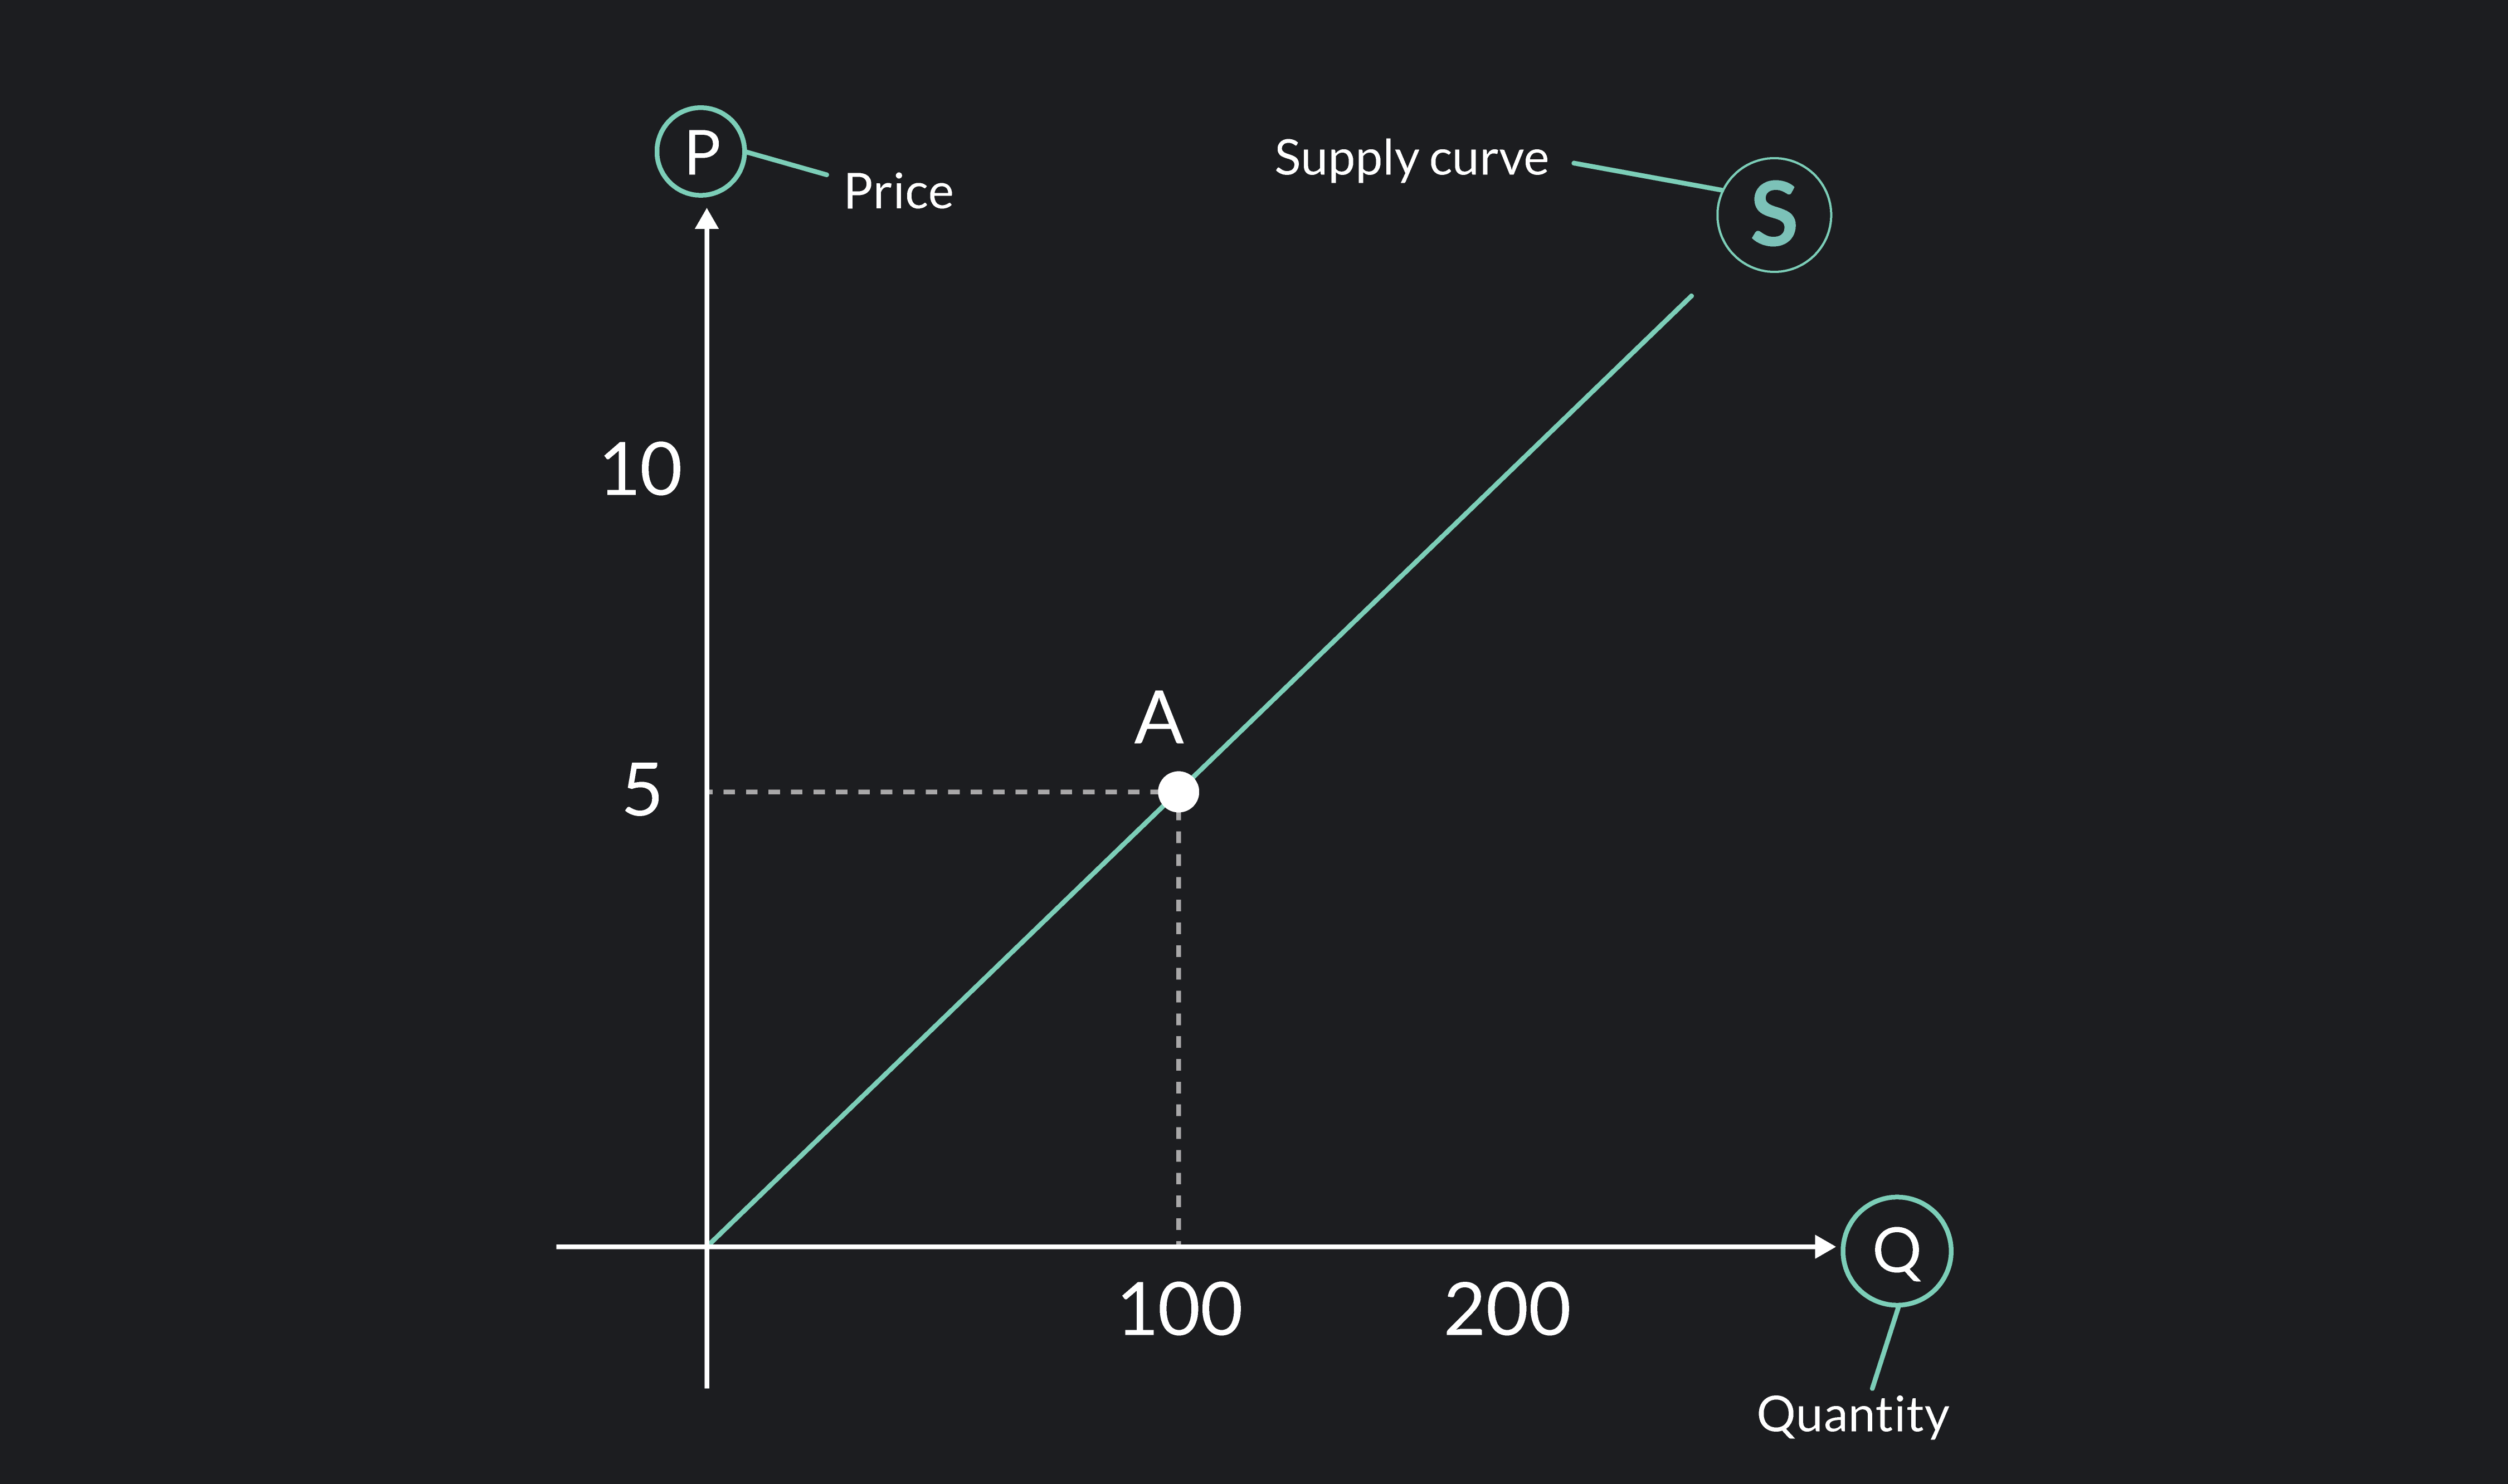
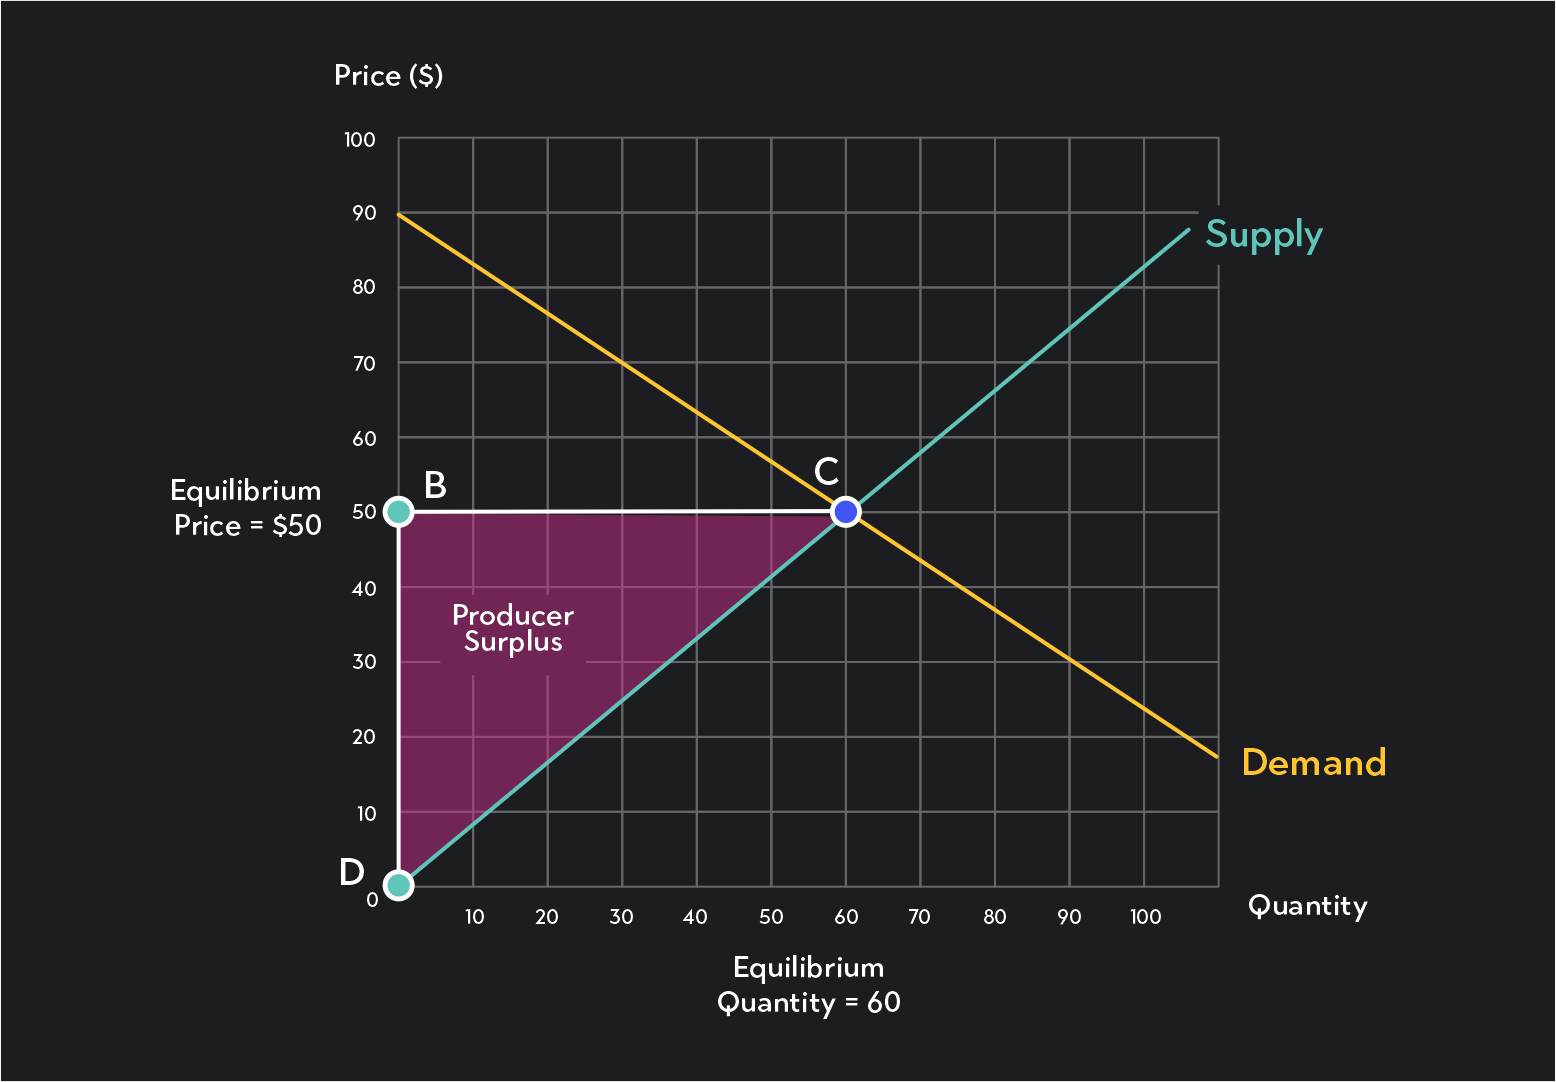
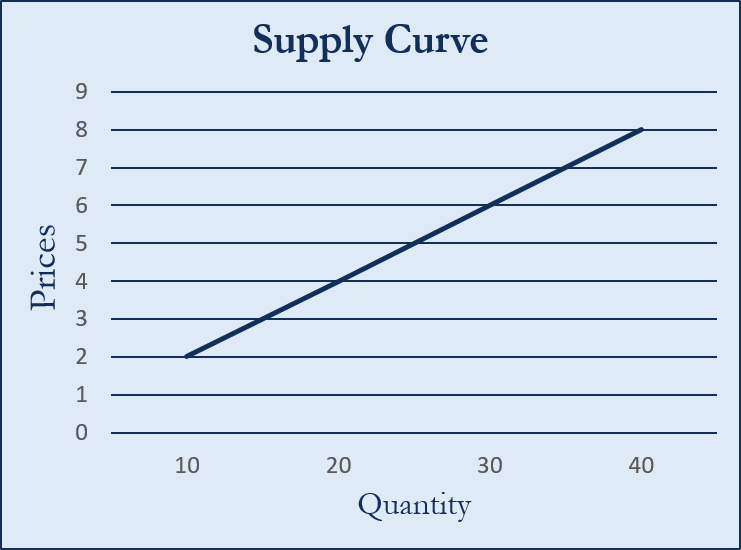
To fully grasp the concept, let's step back and consider the basic definition. The supply curve represents the relationship between the price of a good or service and the quantity that suppliers are willing to produce and offer for sale. It typically slopes upward, indicating that as the price increases, suppliers are generally willing to supply more.
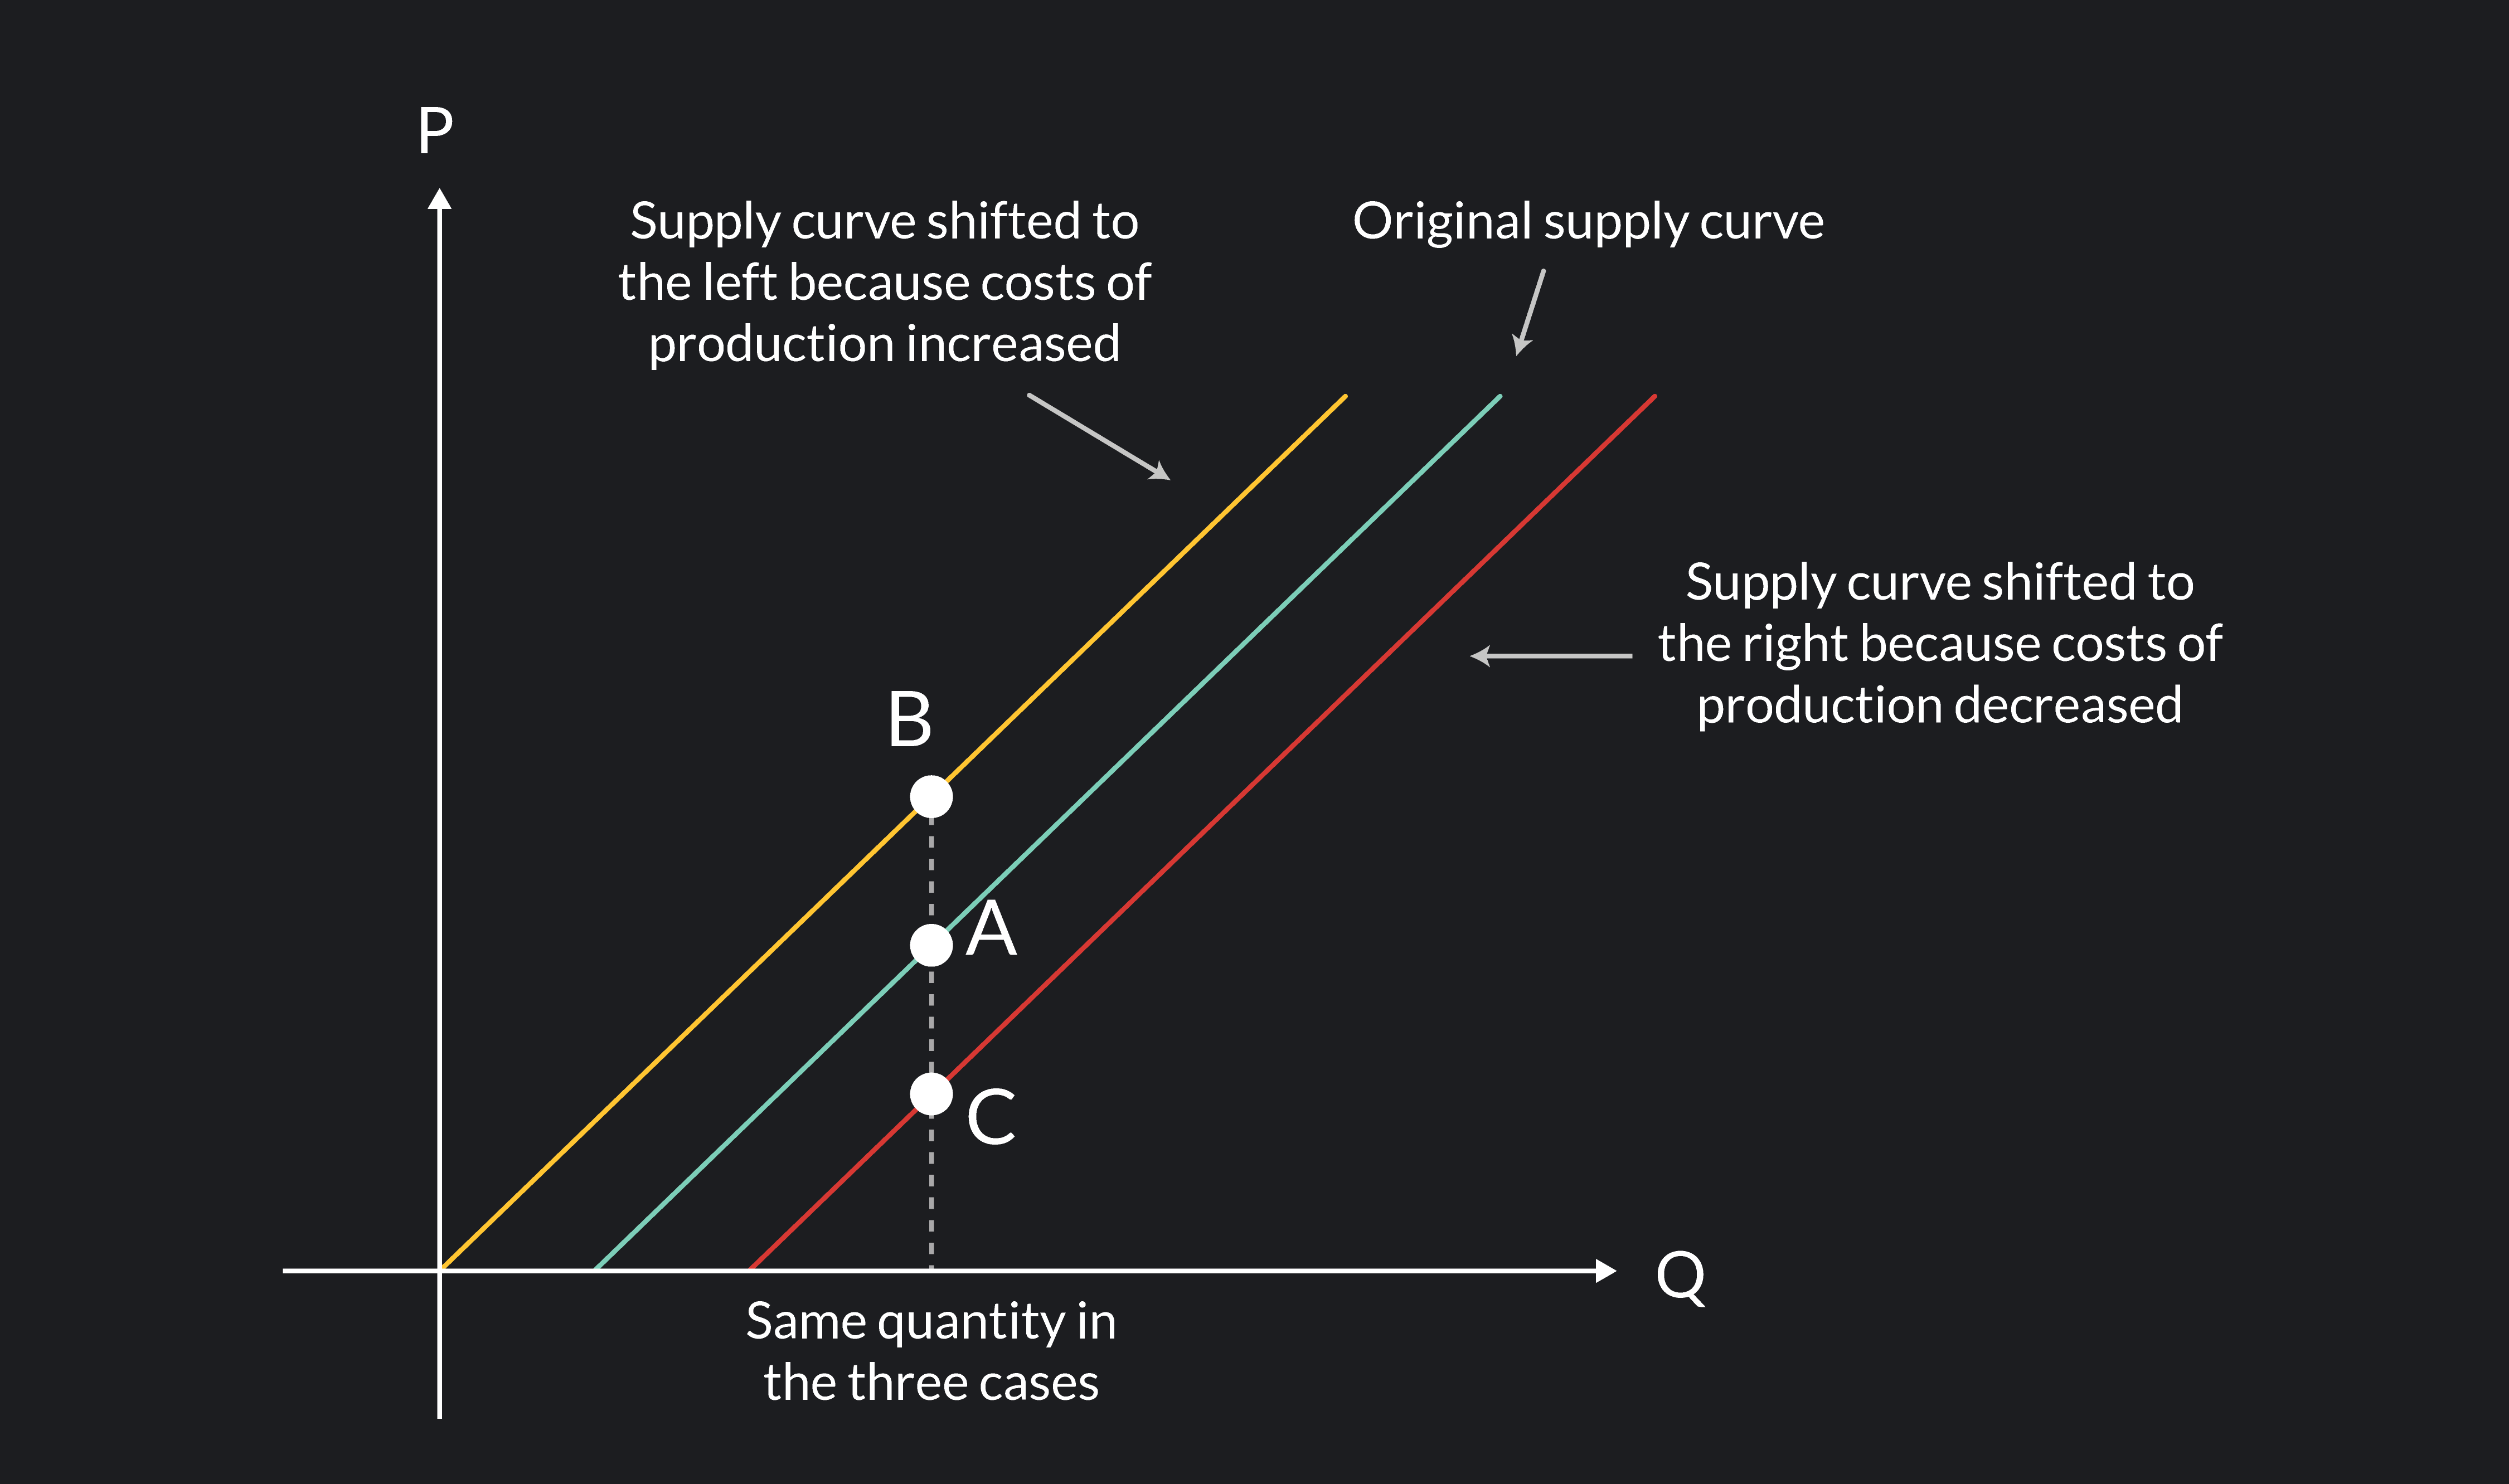
However, the precise location of this curve on a graph is not fixed. It shifts left or right depending on several key determinants.
Factors Affecting the Location of the Supply Curve
The primary factors that shift the supply curve are the costs of production, technology, expectations of future prices, the number of sellers in the market, and government policies.
Costs of Production
Perhaps the most influential factor is the cost of production. This encompasses all the expenses a producer incurs when creating a product or service, including raw materials, labor, energy, and capital.
If the cost of any of these inputs increases, it becomes more expensive to produce each unit, making suppliers less willing to offer the same quantity at the same price. As a result, the supply curve shifts to the left, indicating a decrease in supply.
Conversely, if production costs decrease (for example, due to cheaper raw materials), the supply curve shifts to the right, increasing the supply. For instance, consider a coffee farmer whose crop is affected by rising fertilizer prices: this will increase production costs and shift the supply curve to the left, potentially raising the price of coffee for consumers.
Technology
Technological advancements can drastically alter the supply landscape. New technologies often enable producers to manufacture goods more efficiently, reducing production costs and increasing output.
This leads to a rightward shift in the supply curve. Think of the impact of automated assembly lines in car manufacturing.
Such innovations allow car manufacturers to produce more cars at a lower cost per unit compared to traditional methods, boosting overall supply.
Expectations of Future Prices
Producers' expectations about future prices also play a role. If suppliers believe that the price of their product will rise in the future, they may choose to reduce current supply to sell more at the higher expected price later.
This would cause the supply curve to shift to the left. On the other hand, if producers expect prices to fall, they might increase current supply to sell as much as possible before the price drops, shifting the supply curve to the right.
For example, if oil producers anticipate a significant increase in demand (and consequently, higher prices) next year, they might temporarily reduce their current output to build up inventory, ready to capitalize on the future price surge.
Number of Sellers in the Market
The number of sellers in a market directly impacts the overall supply. When more producers enter the market, the aggregate supply increases, shifting the supply curve to the right.
Conversely, if businesses exit the market, the aggregate supply decreases, shifting the supply curve to the left. The rise of craft breweries provides a good example.
As more independent breweries emerge, the supply of craft beer increases, impacting the availability and pricing of these products.
Government Policies
Government policies, such as taxes, subsidies, and regulations, can significantly influence the supply curve. Taxes on production increase the cost of producing goods, leading to a leftward shift in the supply curve.
Subsidies, on the other hand, reduce production costs, shifting the supply curve to the right. Regulations, such as environmental standards or safety requirements, can increase compliance costs for businesses, resulting in a leftward shift in the supply curve.
For example, if the government imposes stricter emission standards on factories, manufacturers may need to invest in new equipment to comply, increasing their production costs and potentially reducing supply.
The Significance of Understanding Supply Curve Determinants
Understanding the factors influencing the supply curve is crucial for businesses, policymakers, and consumers alike. Businesses can use this knowledge to make informed decisions about production levels, pricing strategies, and investments.
Policymakers can assess the impact of their policies on various industries and make adjustments as needed. Consumers can better understand why prices fluctuate and how market forces affect the availability of goods and services.
For instance, a tech company planning to launch a new smartphone must consider the availability and cost of raw materials like rare earth minerals. Understanding the supply curves for these materials and the factors that might shift them can help the company make more accurate cost projections and pricing decisions.
According to data from the Bureau of Labor Statistics, changes in labor costs significantly affect the supply of services in the healthcare sector. Analyzing these trends can help hospitals and clinics optimize their staffing levels and manage costs effectively.
"The supply curve is not a static entity; it is a dynamic representation of market realities," notes Dr. Emily Carter, an economics professor at the University of Chicago. "Its position reflects the ever-changing conditions that businesses navigate daily."
Understanding the determinants of the supply curve is also vital for anticipating market disruptions. Consider the recent global supply chain issues caused by the COVID-19 pandemic. Lockdowns, transportation bottlenecks, and labor shortages all increased production costs and reduced the supply of many goods, leading to higher prices and scarcity.
By understanding how these factors shift the supply curve, businesses and policymakers can better prepare for and respond to such disruptions. For example, businesses might diversify their supply chains or invest in automation to reduce their reliance on specific suppliers or labor markets.
Looking Ahead
The forces that shape the supply curve are constantly evolving. As technology advances, global supply chains become more complex, and government policies change, businesses must remain vigilant and adaptable. Monitoring key indicators, such as production costs, technological developments, and regulatory changes, is essential for making informed decisions and staying ahead of the curve.
Ultimately, understanding the location of the product supply curve and the factors that influence it is not just an academic exercise. It's a practical tool for navigating the complexities of the modern economy. By grasping these fundamental principles, businesses, policymakers, and consumers can make more informed choices, leading to more efficient and resilient markets.
As we leave the farmer's market, we carry with us not just fresh produce, but a deeper appreciation for the intricate dance of supply and demand that shapes our economic world. The vibrant displays of goods are a testament to the ingenuity and hard work of producers, and understanding the forces that influence their decisions is key to understanding the market itself.
:max_bytes(150000):strip_icc()/supply_curve_final-465c4c4a89504d0faeaa85485b237109.png)
:max_bytes(150000):strip_icc()/supplycurve2-102d446740e14584bc355228d72bfd44.png)


:max_bytes(150000):strip_icc()/Supply-Curve-3-56a27da53df78cf77276a59d.png)