The Production Possibilities Curve Shows That

Imagine a bustling bakery, the aroma of freshly baked bread and sweet pastries filling the air. The baker, with flour dusting their apron, faces a choice: more loaves of crusty sourdough or a batch of delicate croissants. Each decision pulls resources, time, and effort in a different direction. This simple scenario, multiplied across entire economies, is beautifully illustrated by a fundamental economic concept: the Production Possibilities Curve (PPC).
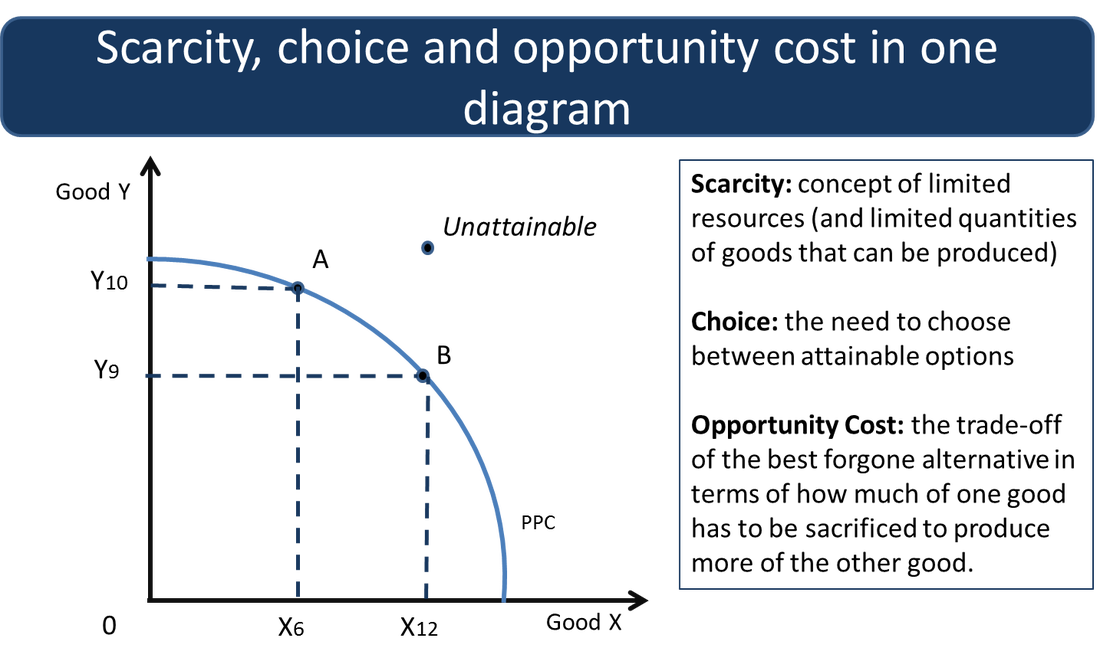
At its heart, the PPC, also sometimes called the Production Possibility Frontier (PPF), is a visual representation of the trade-offs inherent in resource allocation. It illustrates the maximum amount of different combinations of goods or services an economy can produce, given its limited resources and technology. Understanding the PPC allows us to grasp concepts like scarcity, opportunity cost, and efficiency in a tangible way, guiding decisions from personal budgeting to national economic policy.
Unpacking the Production Possibilities Curve
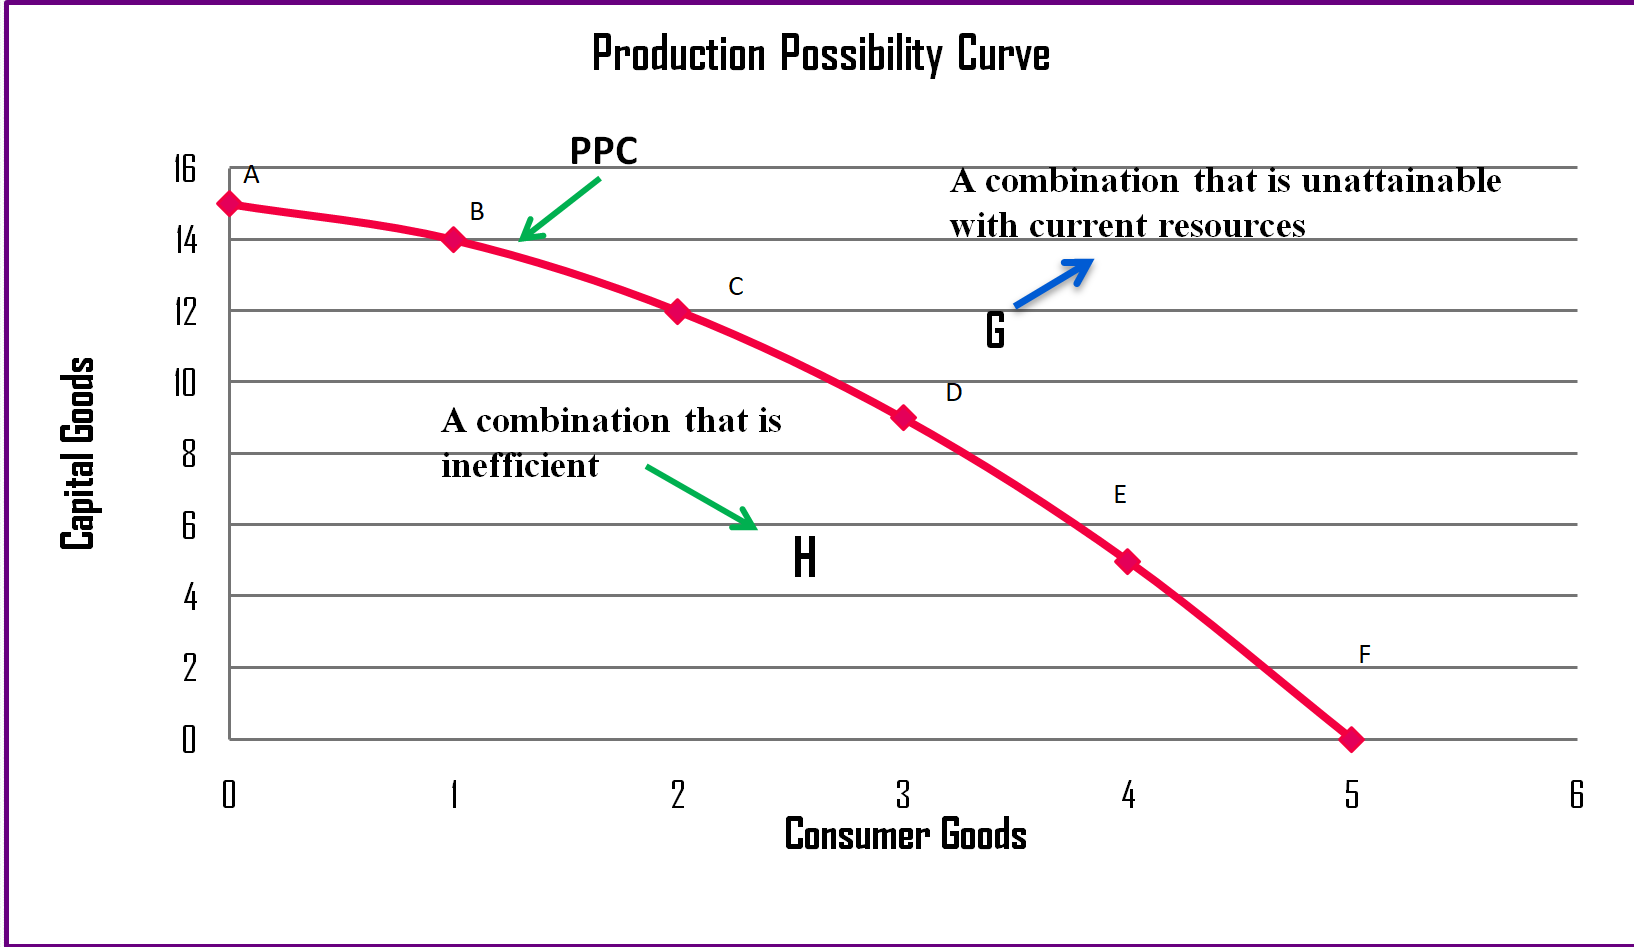
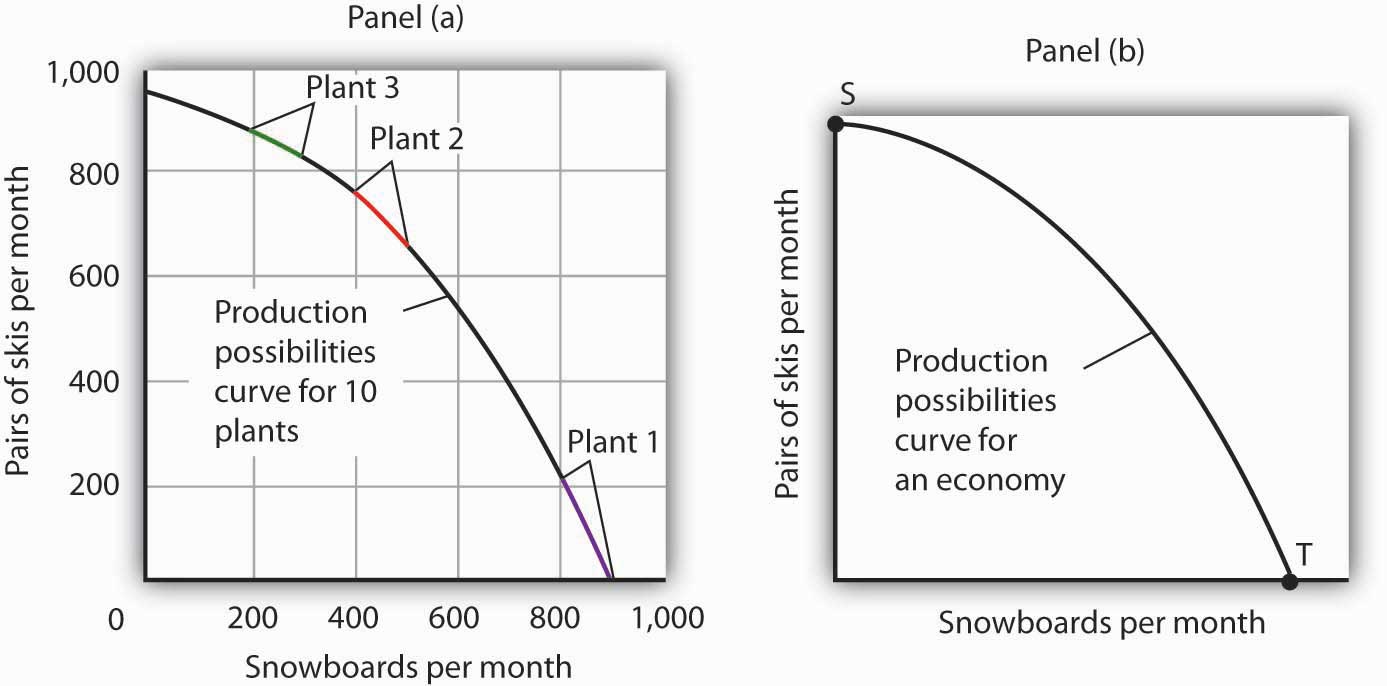
The PPC is a curve (or a line) plotted on a graph. The x-axis and y-axis represent the quantities of two different goods or services. Each point on the curve represents a specific combination of the two goods that can be produced if all resources are used efficiently.
Scarcity: The Foundation
The very existence of the PPC highlights the fundamental economic problem of scarcity. We live in a world where resources – land, labor, capital, and entrepreneurship – are finite. Because of this, societies cannot produce unlimited amounts of everything they desire.
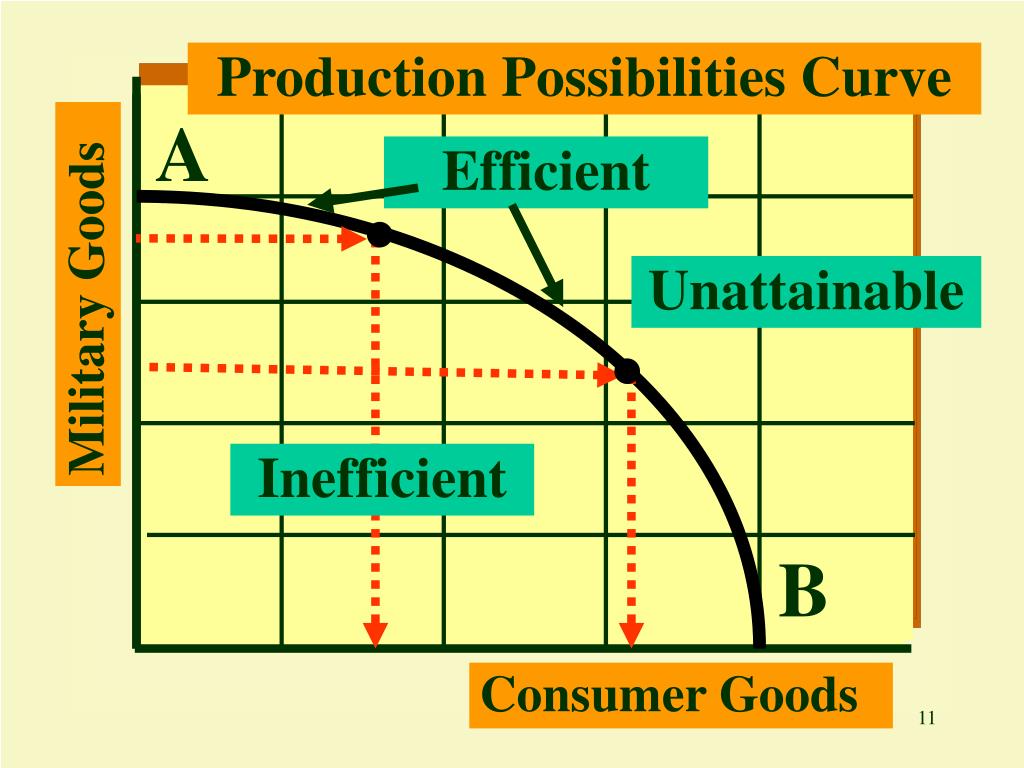
The PPC acts as a boundary. It shows the limits of what an economy can achieve with its current resources and technology. Points outside the curve are unattainable in the present.
Opportunity Cost: The Inevitable Trade-Off
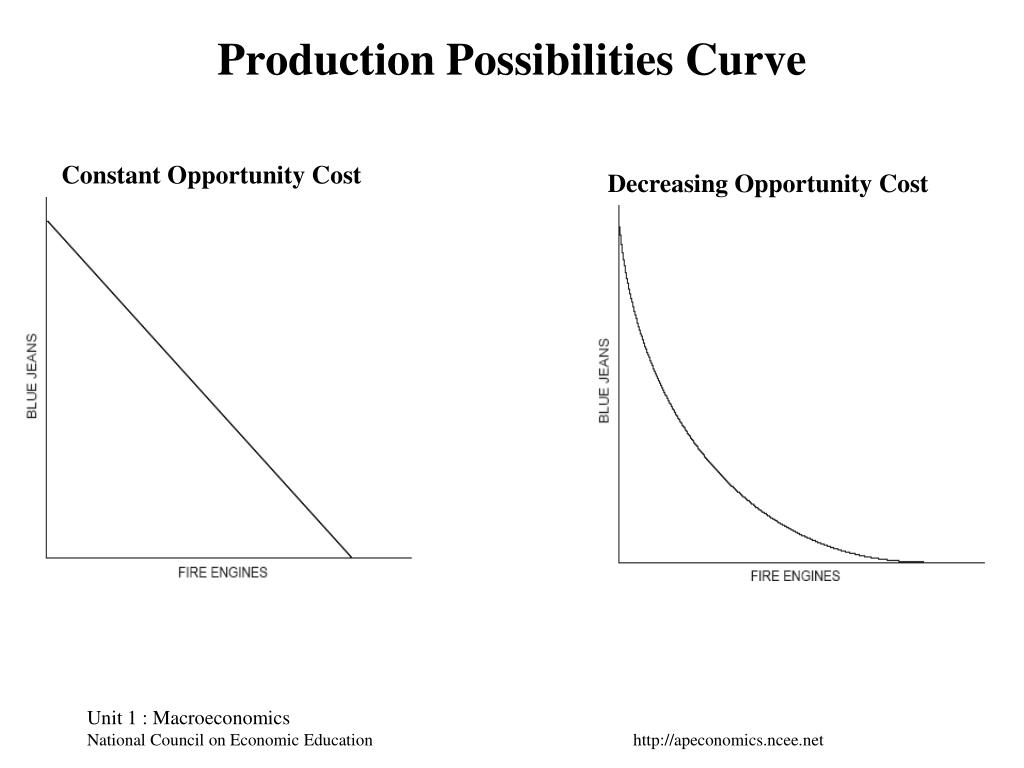
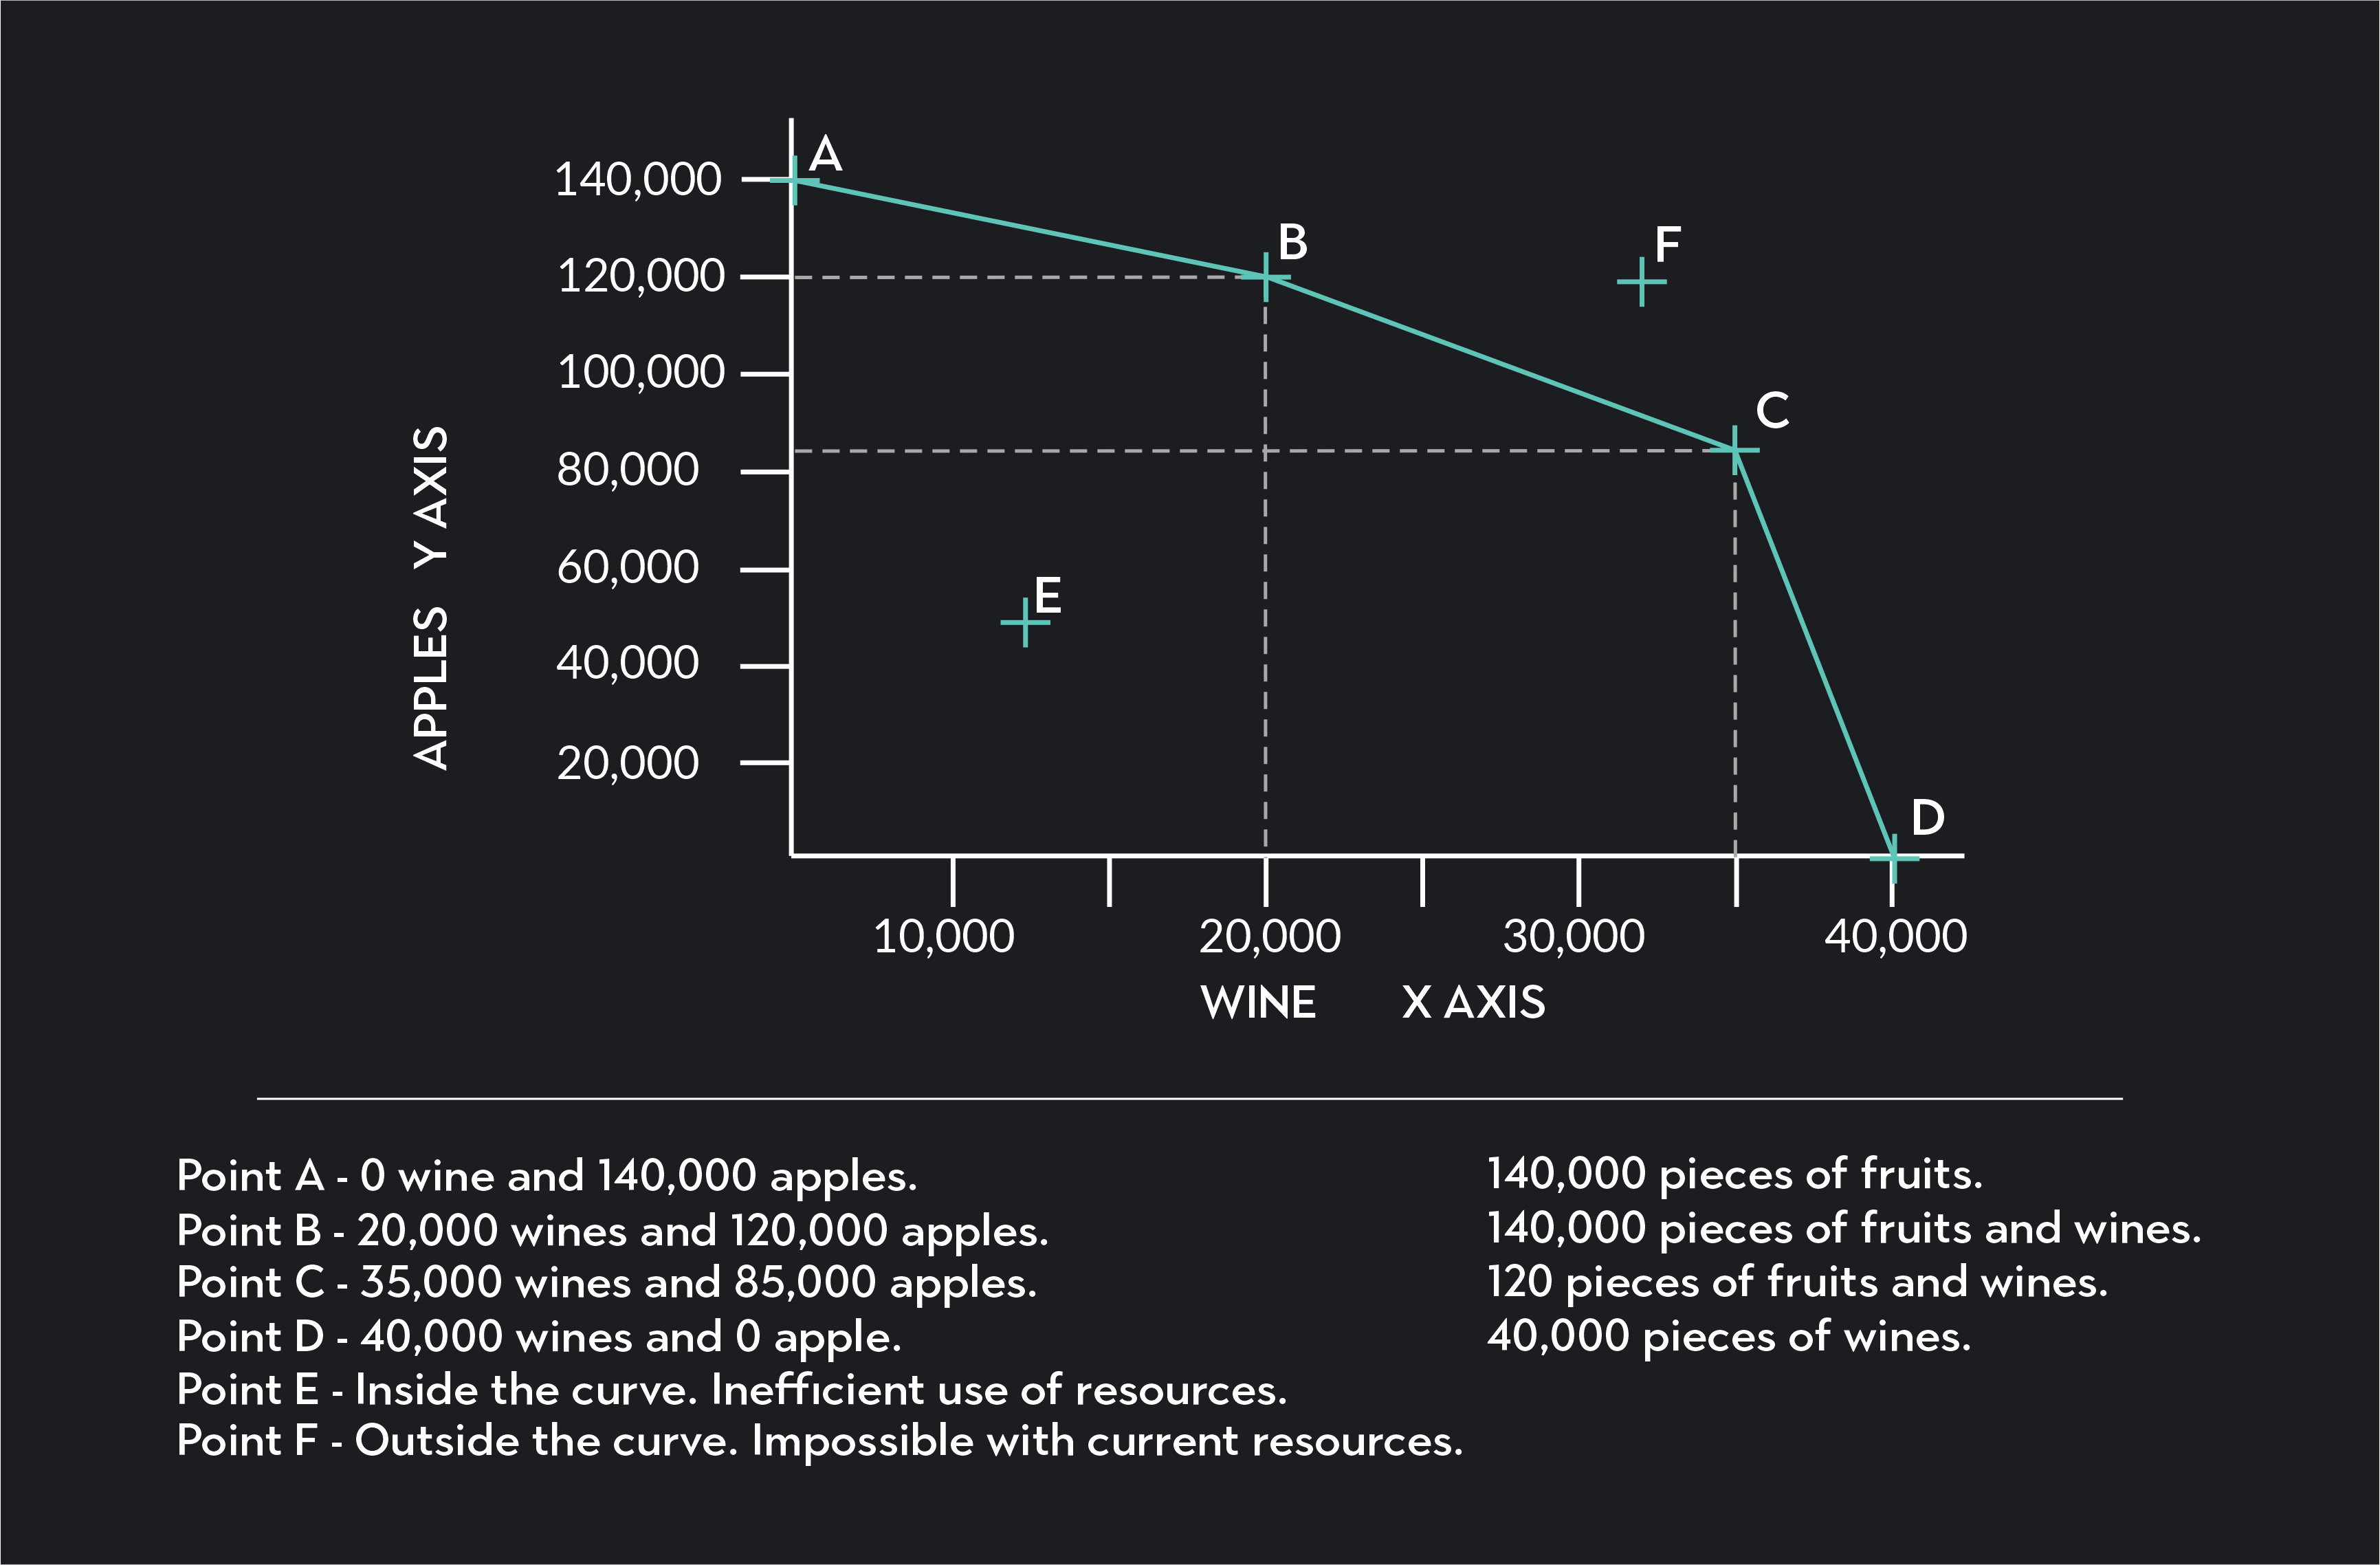
Moving along the PPC demonstrates opportunity cost. Producing more of one good necessarily means producing less of the other. This is because resources must be diverted from one use to another.
The slope of the PPC reflects this opportunity cost. A steeper slope indicates a higher opportunity cost, meaning that more of one good must be sacrificed to produce an additional unit of the other.
Efficiency: Maximizing Output
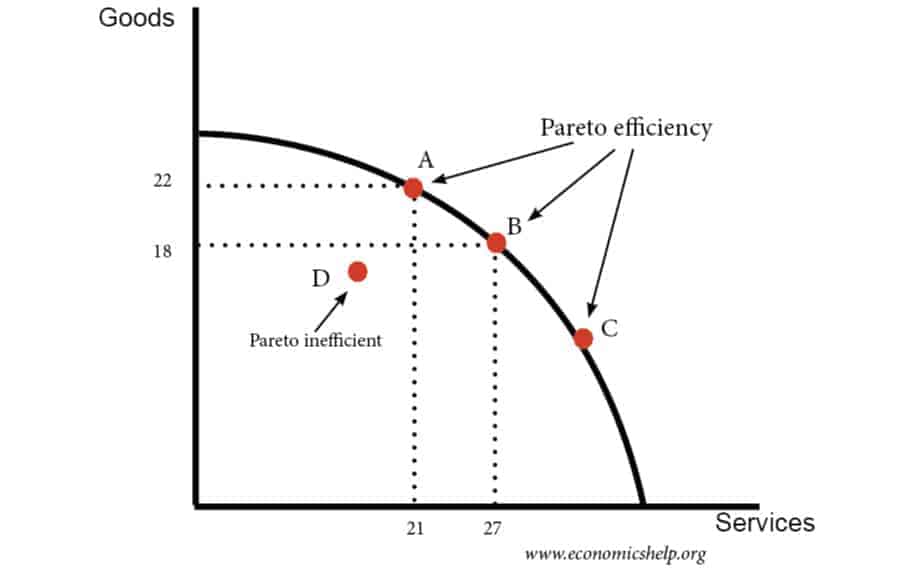
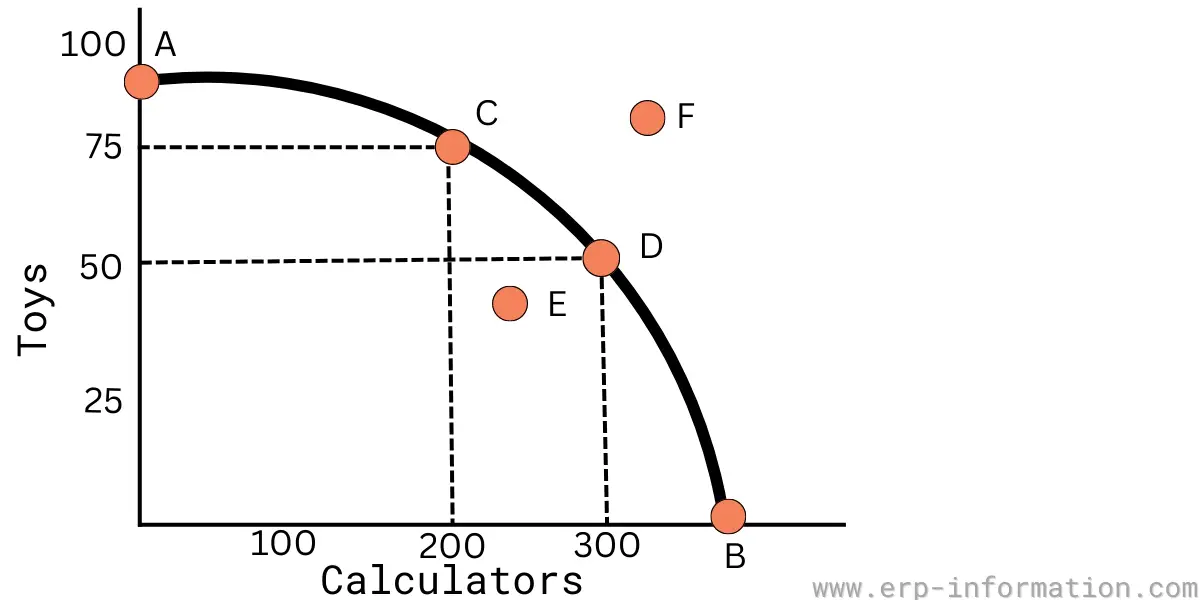
Points *on* the PPC represent productive efficiency. At these points, an economy is using all of its resources fully and is producing the maximum possible output of the two goods.
Points *inside* the curve indicate inefficiency. This could be due to unemployment, underutilization of resources, or simply poor management.
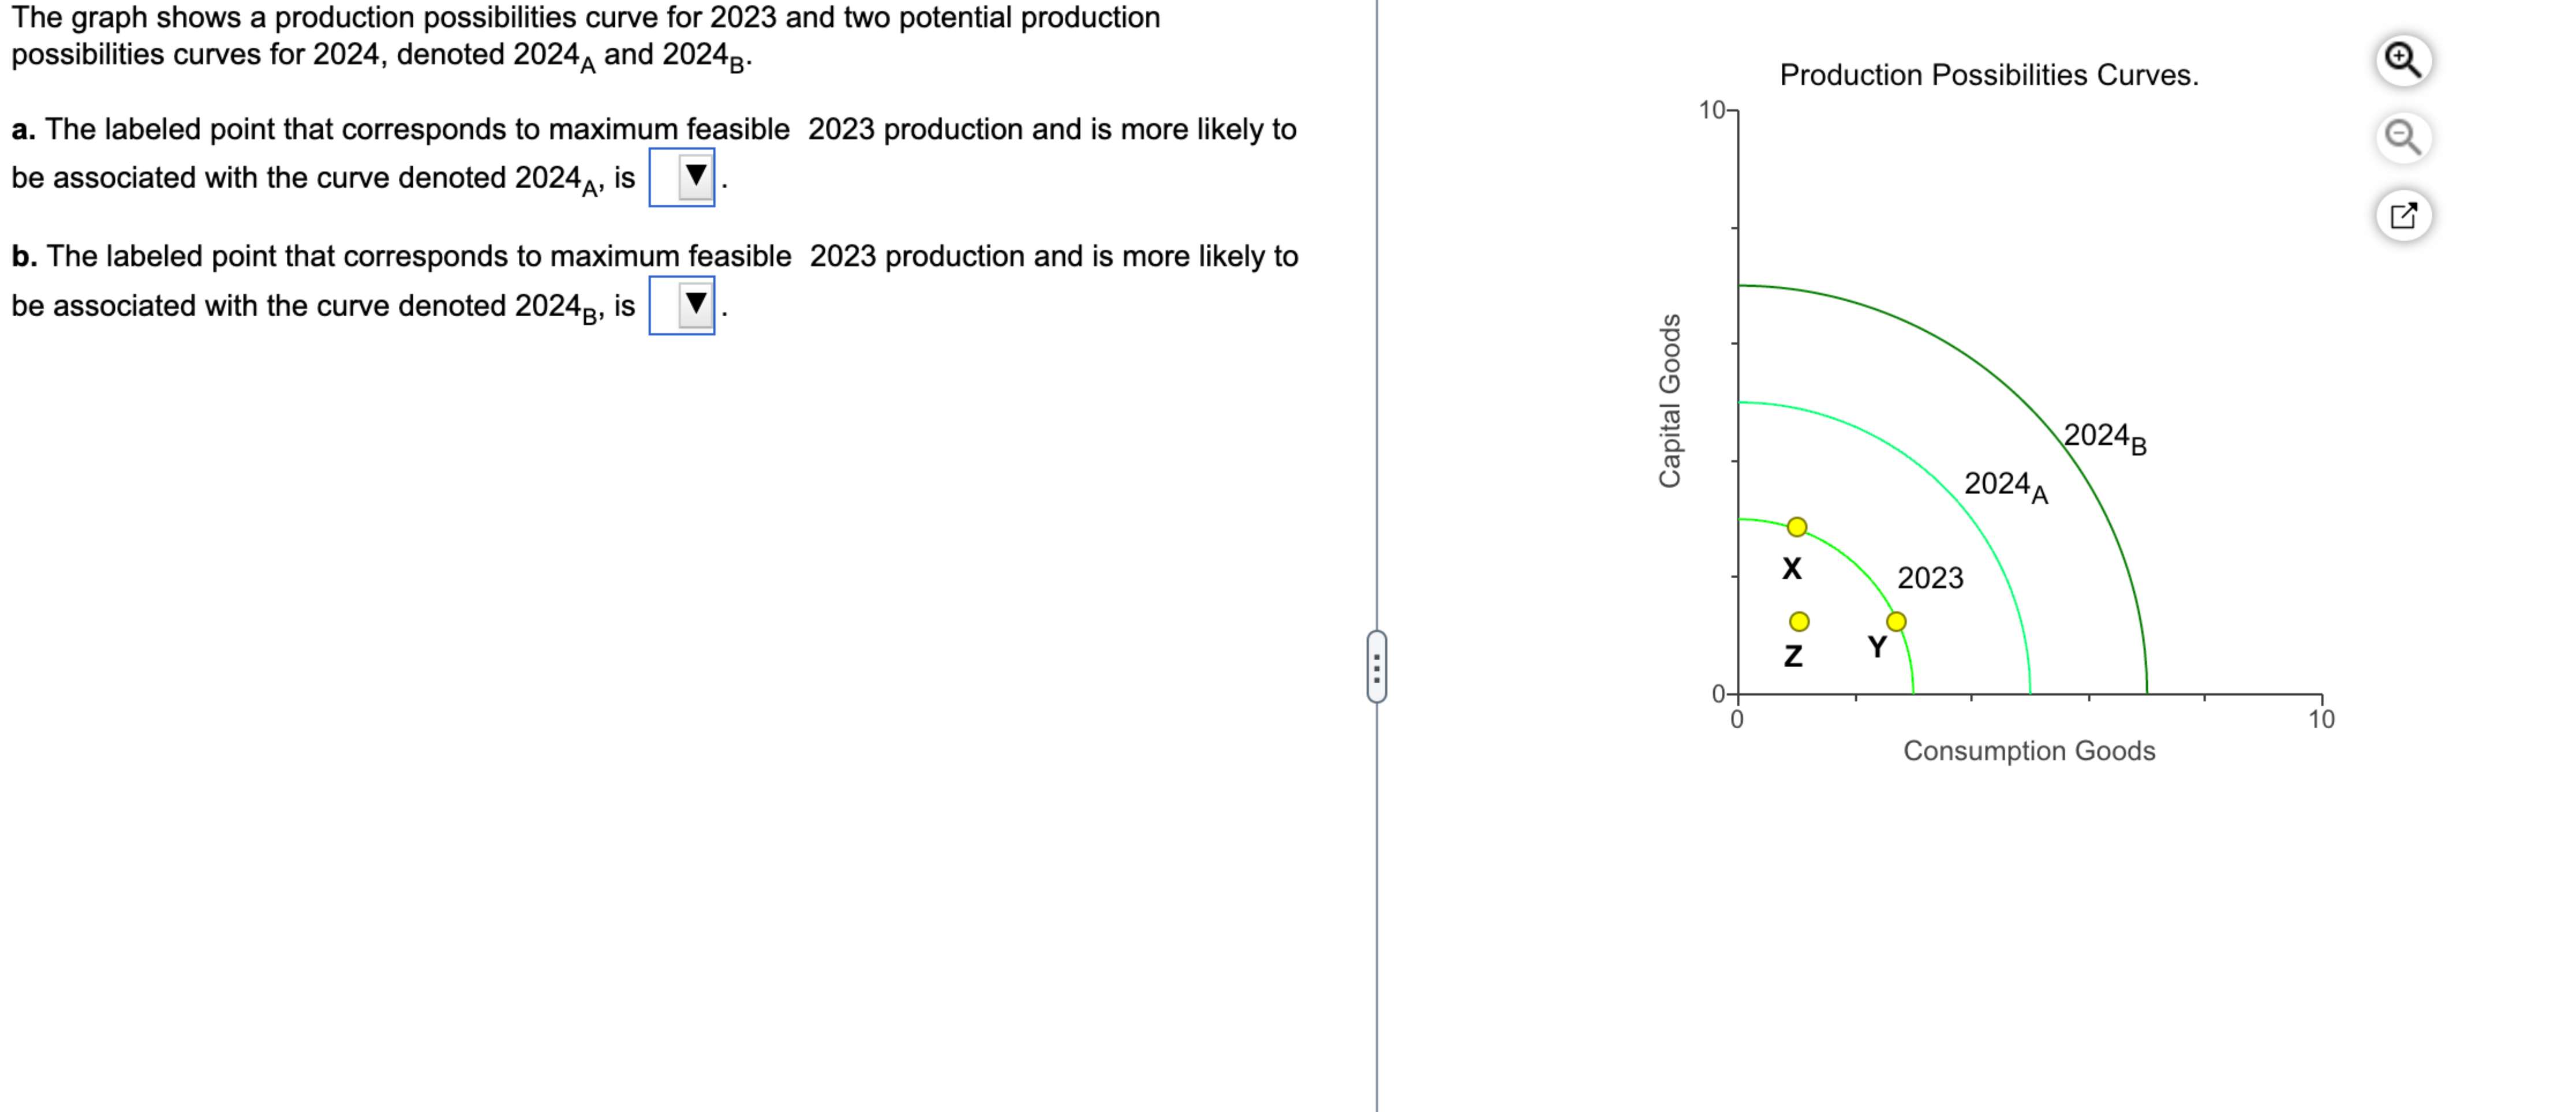
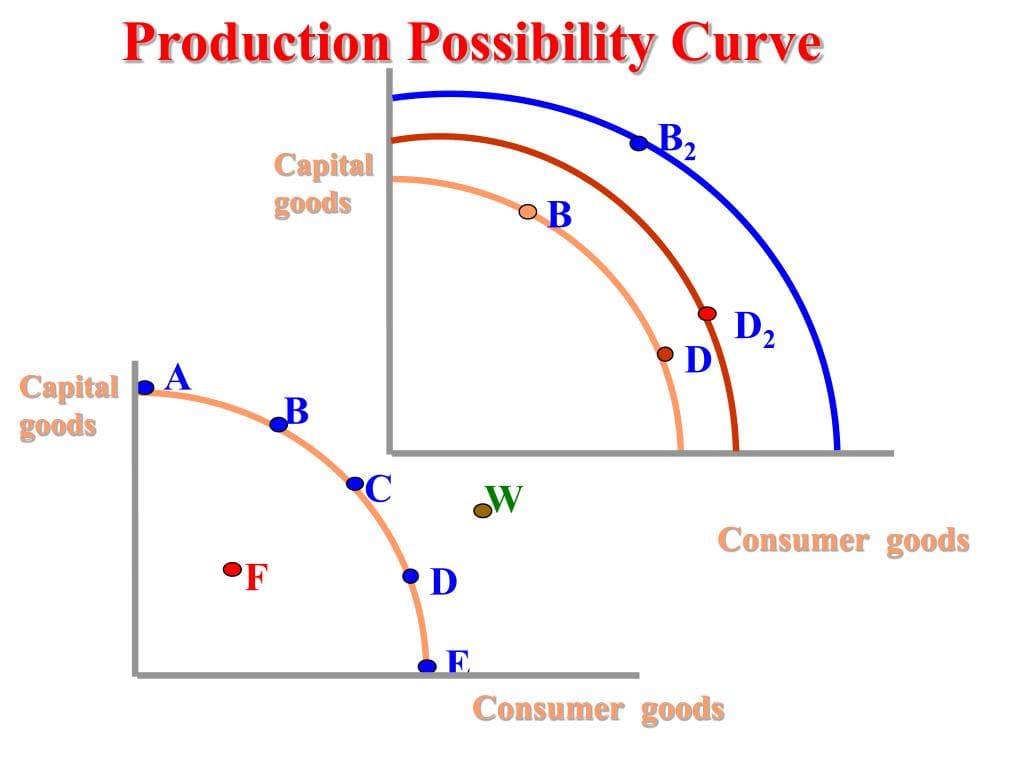
Economic Growth: Shifting the Curve
The PPC is not static; it can shift over time. Economic growth, driven by factors like technological advancements, increased labor force participation, or the discovery of new resources, causes the PPC to shift outward.
An outward shift means the economy can now produce more of both goods than before. This represents an improvement in the overall standard of living.
Real-World Applications and Examples
The PPC isn't just a theoretical concept; it has practical applications in various sectors.
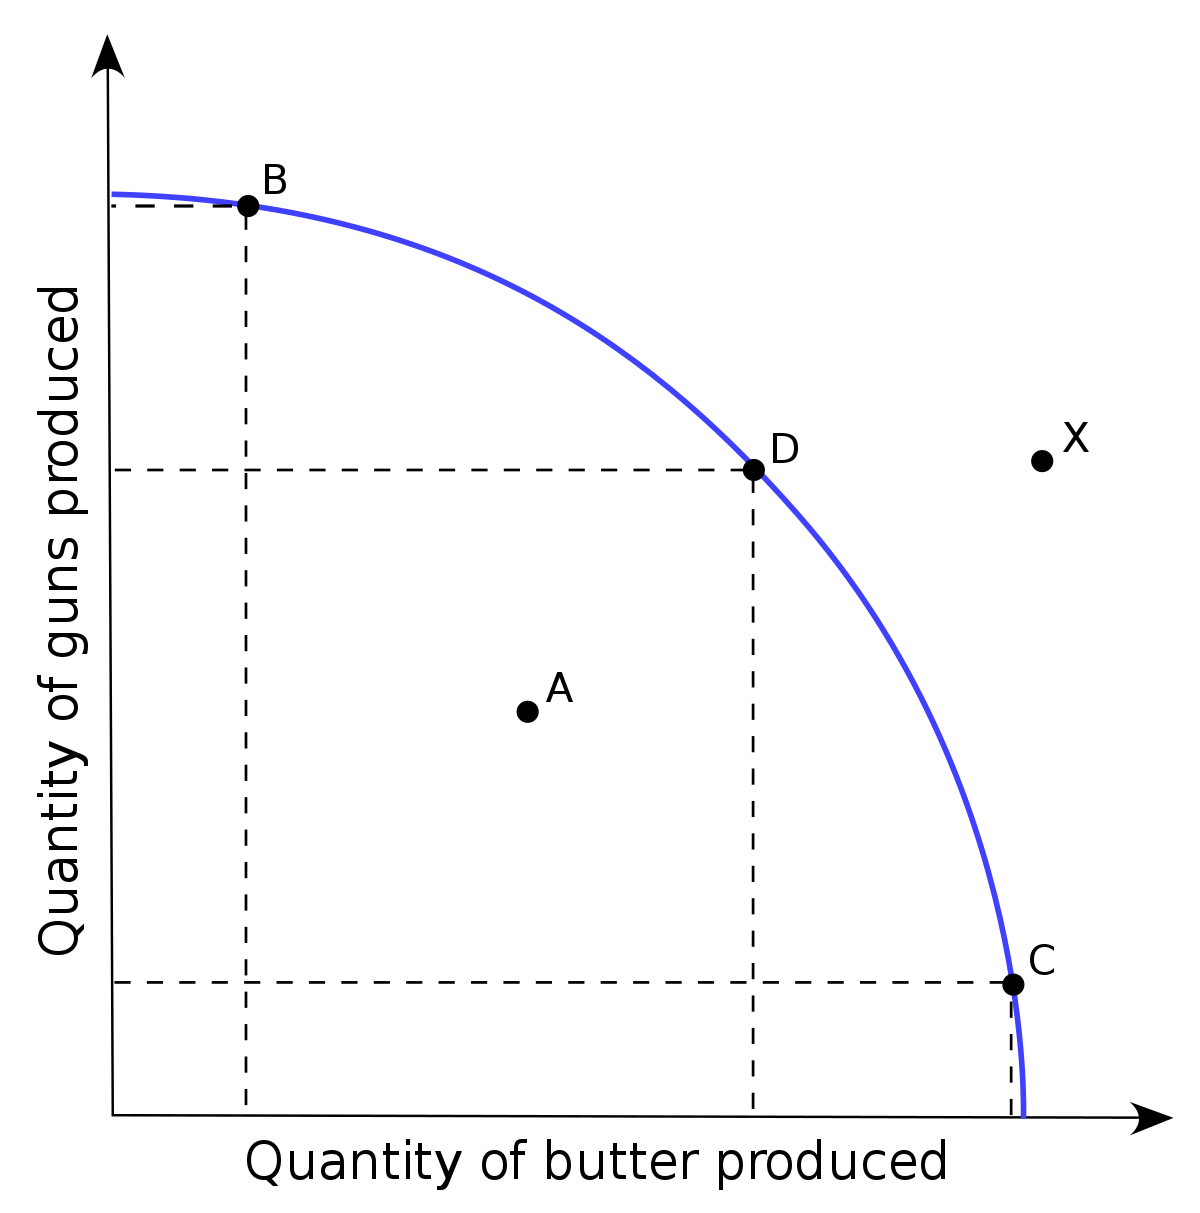
Government Policy: Guns vs. Butter
A classic example used to illustrate the PPC is the trade-off between military spending (guns) and social programs (butter). Resources allocated to defense cannot be used for healthcare, education, or infrastructure.
During times of war, a nation might shift its resources towards military production, moving along the PPC towards "guns," and sacrificing "butter." Peacetime might see a shift back towards social programs.
Business Decisions: Production Mix
Businesses use PPC-like analysis to determine the optimal mix of products to manufacture. A car manufacturer might analyze the trade-off between producing more SUVs versus more fuel-efficient sedans.
Understanding production capabilities and market demand helps them maximize profits and utilize resources efficiently.
Personal Finance: Budget Allocation
Even individuals can relate to the PPC through budgeting. A student with a limited budget faces a trade-off between spending on entertainment and spending on textbooks.
Choosing to spend more on one means having less available for the other, illustrating opportunity cost in a personal context.
Beyond the Basics: Assumptions and Limitations
While a powerful tool, the PPC relies on certain assumptions. Understanding these assumptions and their limitations is crucial for accurate interpretation.
The model typically assumes that resources are fixed and that technology is constant. In reality, both resources and technology can change over time, as we saw with the potential of economic growth.
The PPC also simplifies the economy by focusing on only two goods. Real-world economies produce a vast array of goods and services, making the analysis more complex.
The Importance of Understanding the PPC
The Production Possibilities Curve offers a valuable framework for understanding the fundamental economic challenges of scarcity and choice. It highlights the trade-offs involved in resource allocation and the importance of efficiency.
By visualizing these concepts, the PPC empowers individuals, businesses, and policymakers to make more informed decisions. This could be choices about production, investment, and resource management.
Robert J. Gordon, in his work on economic growth, highlights the importance of productivity and technological advancements for pushing the PPC outward and improving living standards.
Looking Ahead: Dynamic Applications
As economies evolve, the applications of the PPC continue to adapt. In today's world, considerations like environmental sustainability are increasingly integrated into PPC analysis.
The trade-off between economic growth and environmental protection can be visualized using a PPC. This analysis helps policymakers explore strategies for sustainable development.
Moreover, the concept of human capital – the skills and knowledge of the workforce – plays a crucial role in shifting the PPC outward. Investments in education and training can significantly enhance an economy's productive capacity, according to research from organizations like the World Bank.
In Conclusion: Embracing the Trade-Offs
The Production Possibilities Curve is more than just a graph; it's a lens through which we can view the economic landscape. It reminds us that every decision, from the individual level to the national level, involves trade-offs.
By understanding these trade-offs, we can strive to make more informed choices that lead to greater efficiency, sustainable growth, and ultimately, a better future. Just like the baker carefully weighing their flour and time, we too must understand the limits and possibilities of our resources to bake a better economic future.

:max_bytes(150000):strip_icc()/production-possibilities-curve-definition-explanation-examples-4169680_FINAL-1312d1267f804e0db9f7d4bf70c8d839.png)