Total Asset Turnover Is Computed As Net /average Total Assets
Imagine a bustling marketplace, vendors hawking their wares, customers haggling for the best deals. Each transaction, each sale, contributes to the overall activity of the marketplace. Similarly, in the world of finance, companies are constantly engaged in turning their assets into sales. This activity can be measured and analyzed, offering valuable insights into a company's efficiency and performance.
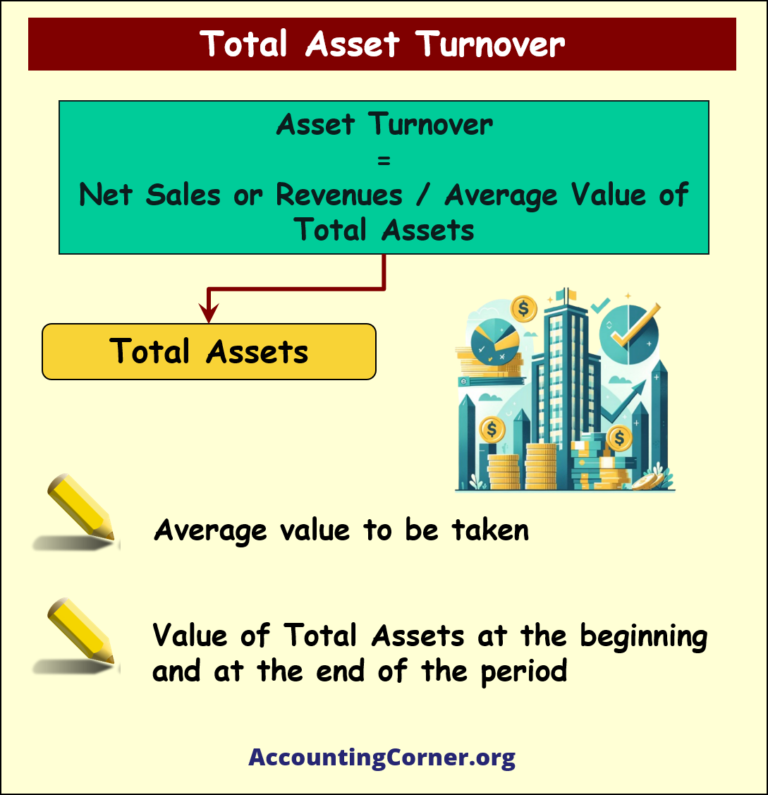
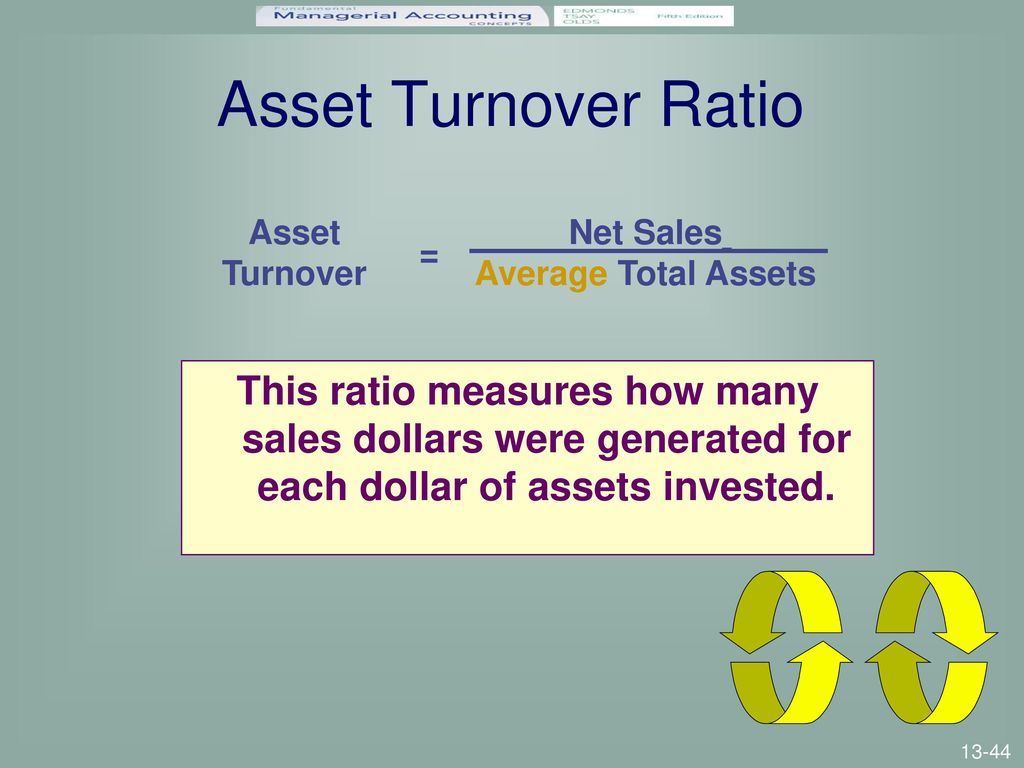
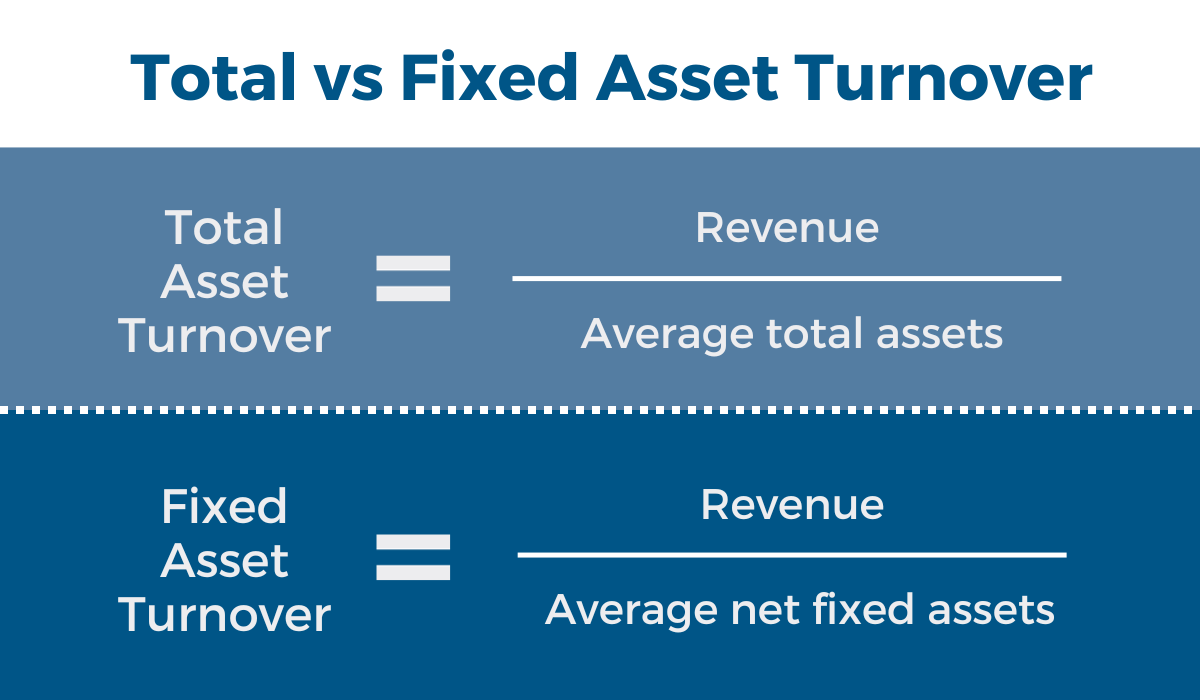
The total asset turnover ratio, calculated as net sales divided by average total assets, is a crucial metric that reveals how effectively a company utilizes its assets to generate revenue. It essentially answers the question: "For every dollar invested in assets, how much revenue is the company generating?" This article will delve into the intricacies of this ratio, exploring its significance, calculation, and interpretation, providing a comprehensive understanding for both seasoned investors and curious beginners.
Understanding Asset Turnover: The Basics
The total asset turnover ratio is a key efficiency ratio. It provides a snapshot of how well a company is managing its assets to create sales. A higher ratio generally indicates greater efficiency, meaning the company is generating more revenue per dollar of assets.
Conversely, a lower ratio might suggest that the company is not utilizing its assets effectively, or that it has invested in assets that are not generating sufficient sales. However, it's crucial to avoid drawing premature conclusions based solely on this single ratio.
The Formula: Net Sales / Average Total Assets
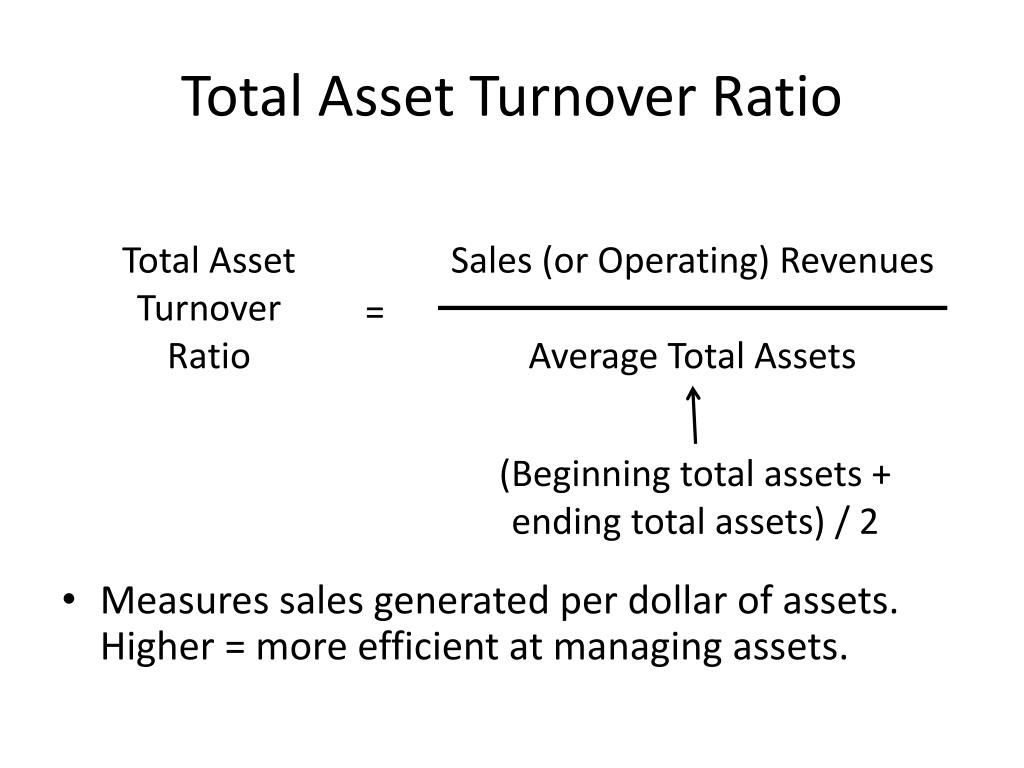
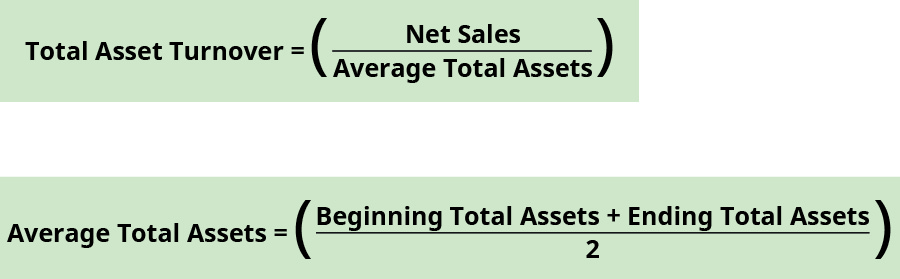
The formula for the total asset turnover ratio is straightforward: Net Sales / Average Total Assets. Let's break down each component of this equation.
Net Sales represent the total revenue generated by the company, minus any returns, allowances, and discounts. This figure is usually readily available on the company's income statement.
Average Total Assets is calculated by adding the total assets at the beginning of the period (usually the beginning of the year) to the total assets at the end of the period, and then dividing by two. This provides a more representative picture of the assets used throughout the period, as the asset base can fluctuate.
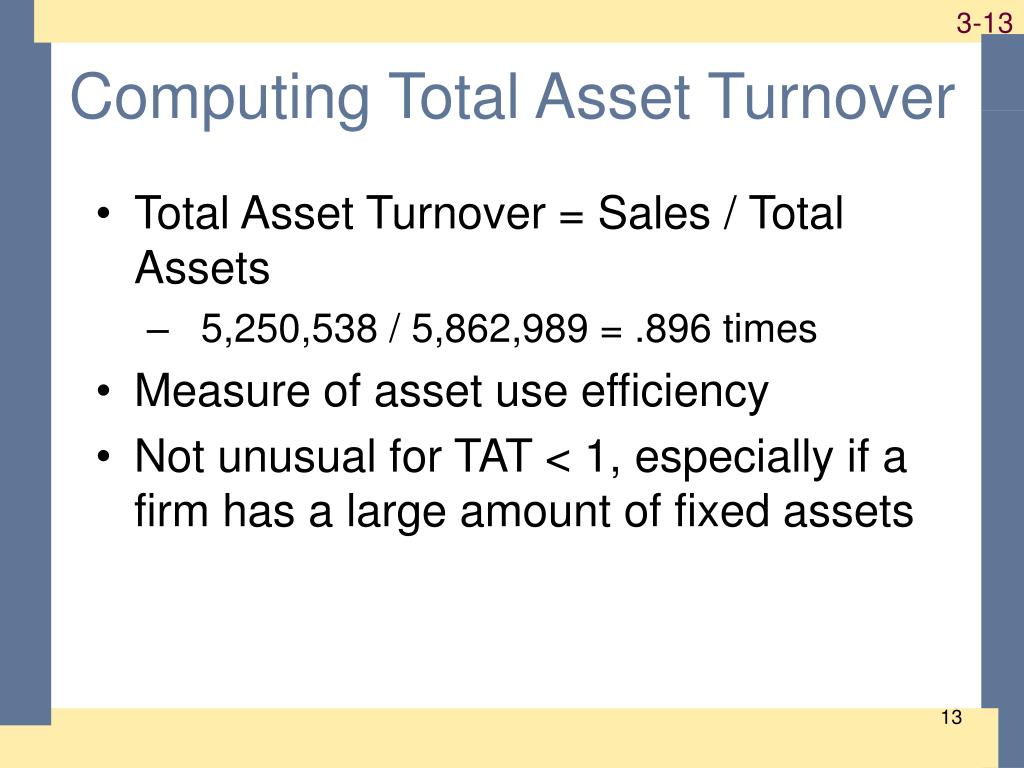
For example, if a company has net sales of $1,000,000 and average total assets of $500,000, the total asset turnover ratio would be 2.0. This means that for every dollar of assets, the company generated $2 in sales.
Significance of the Total Asset Turnover Ratio
The total asset turnover ratio is a valuable tool for investors, analysts, and company management alike. It offers insights into several key aspects of a company's performance.
Firstly, it helps assess operational efficiency. A higher ratio suggests that the company is efficiently using its assets to generate sales. This might be due to effective inventory management, efficient production processes, or strong sales strategies.
Secondly, it allows for benchmarking against competitors. By comparing a company's asset turnover ratio to that of its peers in the same industry, one can gain insights into its relative performance. A company with a higher ratio than its competitors may have a competitive advantage in terms of asset utilization.
Thirdly, it can help identify potential problems. A declining asset turnover ratio over time may indicate that the company is becoming less efficient, perhaps due to over-investment in assets or declining sales. This warrants further investigation.
Industry-Specific Considerations
It is crucial to remember that the ideal asset turnover ratio can vary significantly across different industries. Capital-intensive industries, such as manufacturing or utilities, typically have lower asset turnover ratios. This is because they require significant investments in fixed assets, such as factories and equipment, to generate revenue.
In contrast, service-based industries, such as consulting or software, tend to have higher asset turnover ratios. This is because they require fewer physical assets to generate revenue.
Therefore, it's essential to compare a company's asset turnover ratio to that of its peers within the same industry to get a meaningful assessment of its performance. For example, comparing a retailer’s asset turnover to a telecom’s would be comparing apples to oranges.
Factors Affecting the Ratio
Several factors can influence a company's total asset turnover ratio. These include:
Sales Growth: An increase in sales will generally lead to a higher asset turnover ratio, assuming that assets remain relatively constant.
Asset Investment: Significant investments in new assets, such as expanding a factory or purchasing new equipment, can initially lower the ratio, especially if the assets have not yet begun to generate significant revenue. However, these investments should lead to increased sales in the future, which should then improve the ratio.
Inventory Management: Efficient inventory management is crucial for maximizing asset turnover. Holding excessive inventory ties up capital and reduces the ratio. Companies that can effectively manage their inventory levels and minimize storage costs will typically have higher ratios.
Depreciation: Depreciation expense reduces the book value of assets over time, which can gradually increase the asset turnover ratio. Companies with older assets that have been heavily depreciated may have artificially inflated ratios.
Interpreting the Results: Beyond the Numbers
While the total asset turnover ratio provides valuable insights, it's important to interpret it in conjunction with other financial metrics and qualitative factors. For example, a high asset turnover ratio might be a positive sign, but if it's achieved by cutting prices aggressively, it could be detrimental to profitability.
Similarly, a low asset turnover ratio might not necessarily be a cause for concern if the company is investing heavily in long-term growth initiatives that are expected to generate significant returns in the future.
Analyzing the trend of the ratio over time is also crucial. A consistent increase in the ratio suggests improving efficiency, while a declining trend may signal potential problems. It's crucial to understand the context and factors driving these trends before drawing any conclusions.
Real-World Examples
Let's look at a hypothetical example. Company A, a retail chain, has net sales of $5 million and average total assets of $2.5 million. Its asset turnover ratio is 2.0. Company B, another retail chain in the same industry, has net sales of $4 million and average total assets of $3 million. Its asset turnover ratio is 1.33.
Based on this analysis, Company A appears to be more efficient in utilizing its assets to generate sales than Company B. Investors might perceive Company A as a more attractive investment opportunity.
However, further analysis is needed to understand the underlying reasons for the difference in asset turnover ratios. Factors such as product mix, pricing strategy, inventory management practices, and store locations could all contribute to the disparity.
Limitations of the Ratio
Like any financial metric, the total asset turnover ratio has its limitations. As discussed before, comparing companies in different industries is generally not useful. Also, ratios based on accounting data may not reflect the actual market value of the assets or sales.
Furthermore, the ratio is based on historical data, which may not be indicative of future performance. It is essential to consider qualitative factors, such as management quality and competitive landscape, when making investment decisions.
Conclusion
The total asset turnover ratio is a valuable tool for assessing a company's efficiency in utilizing its assets to generate sales. By understanding the formula, its significance, and its limitations, investors and analysts can gain valuable insights into a company's performance and make more informed decisions.
However, it's crucial to remember that the ratio is just one piece of the puzzle. A comprehensive analysis of a company's financial statements and qualitative factors is necessary for a complete understanding of its strengths and weaknesses. The marketplace, after all, is complex, and a single number can never tell the whole story.