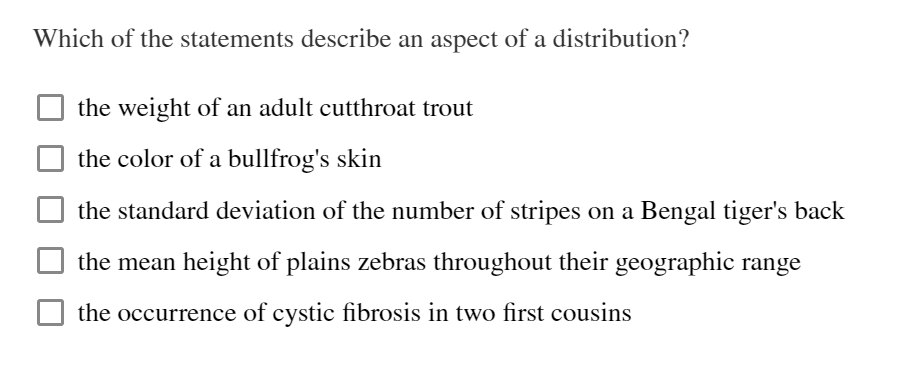
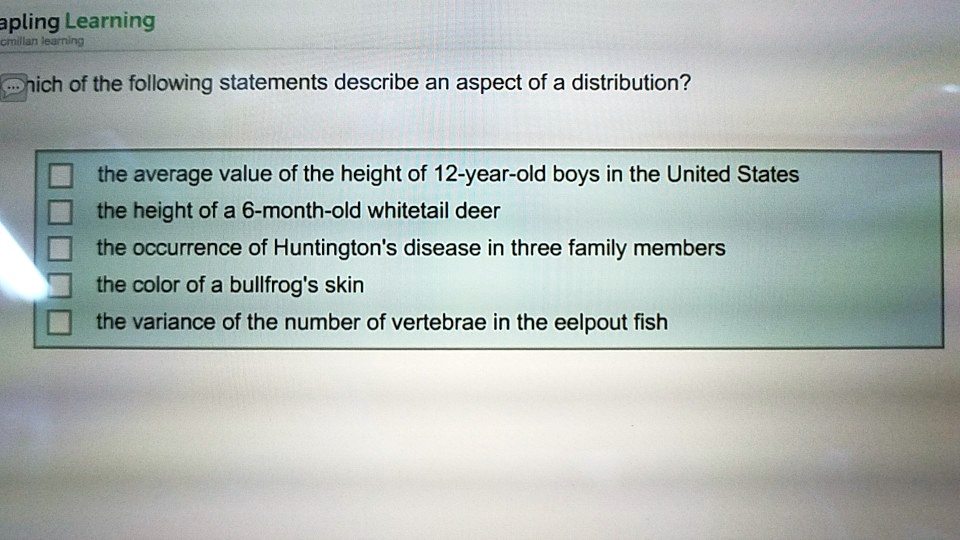
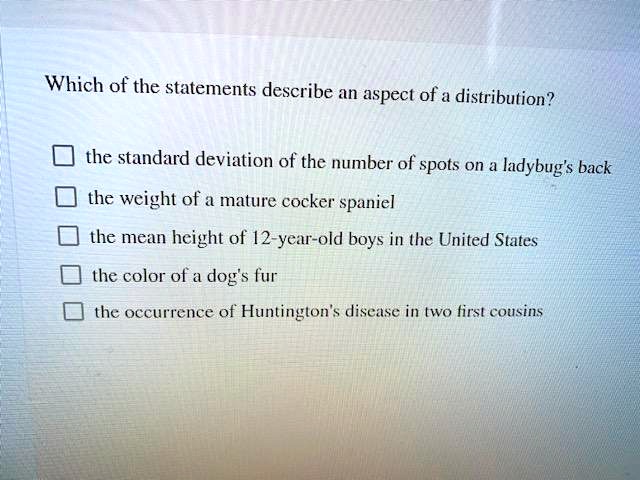
Which Of The Statements Describe An Aspect Of A Distribution
A critical data literacy gap is impacting decision-making across industries, stemming from widespread misunderstanding of fundamental statistical concepts. Recent studies reveal a concerning trend: professionals struggle to accurately interpret aspects of data distributions, leading to flawed analyses and potentially harmful conclusions.
This article addresses the urgent need for clarity by outlining key statements that correctly describe aspects of a distribution, based on statistical definitions and widely accepted practices.
Understanding Distributions: Key Aspects
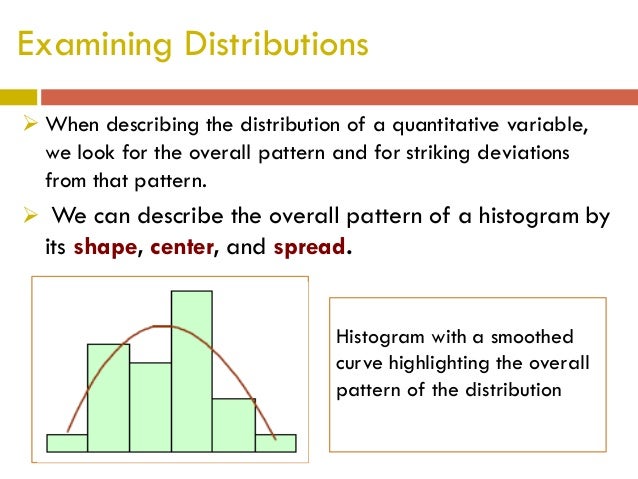
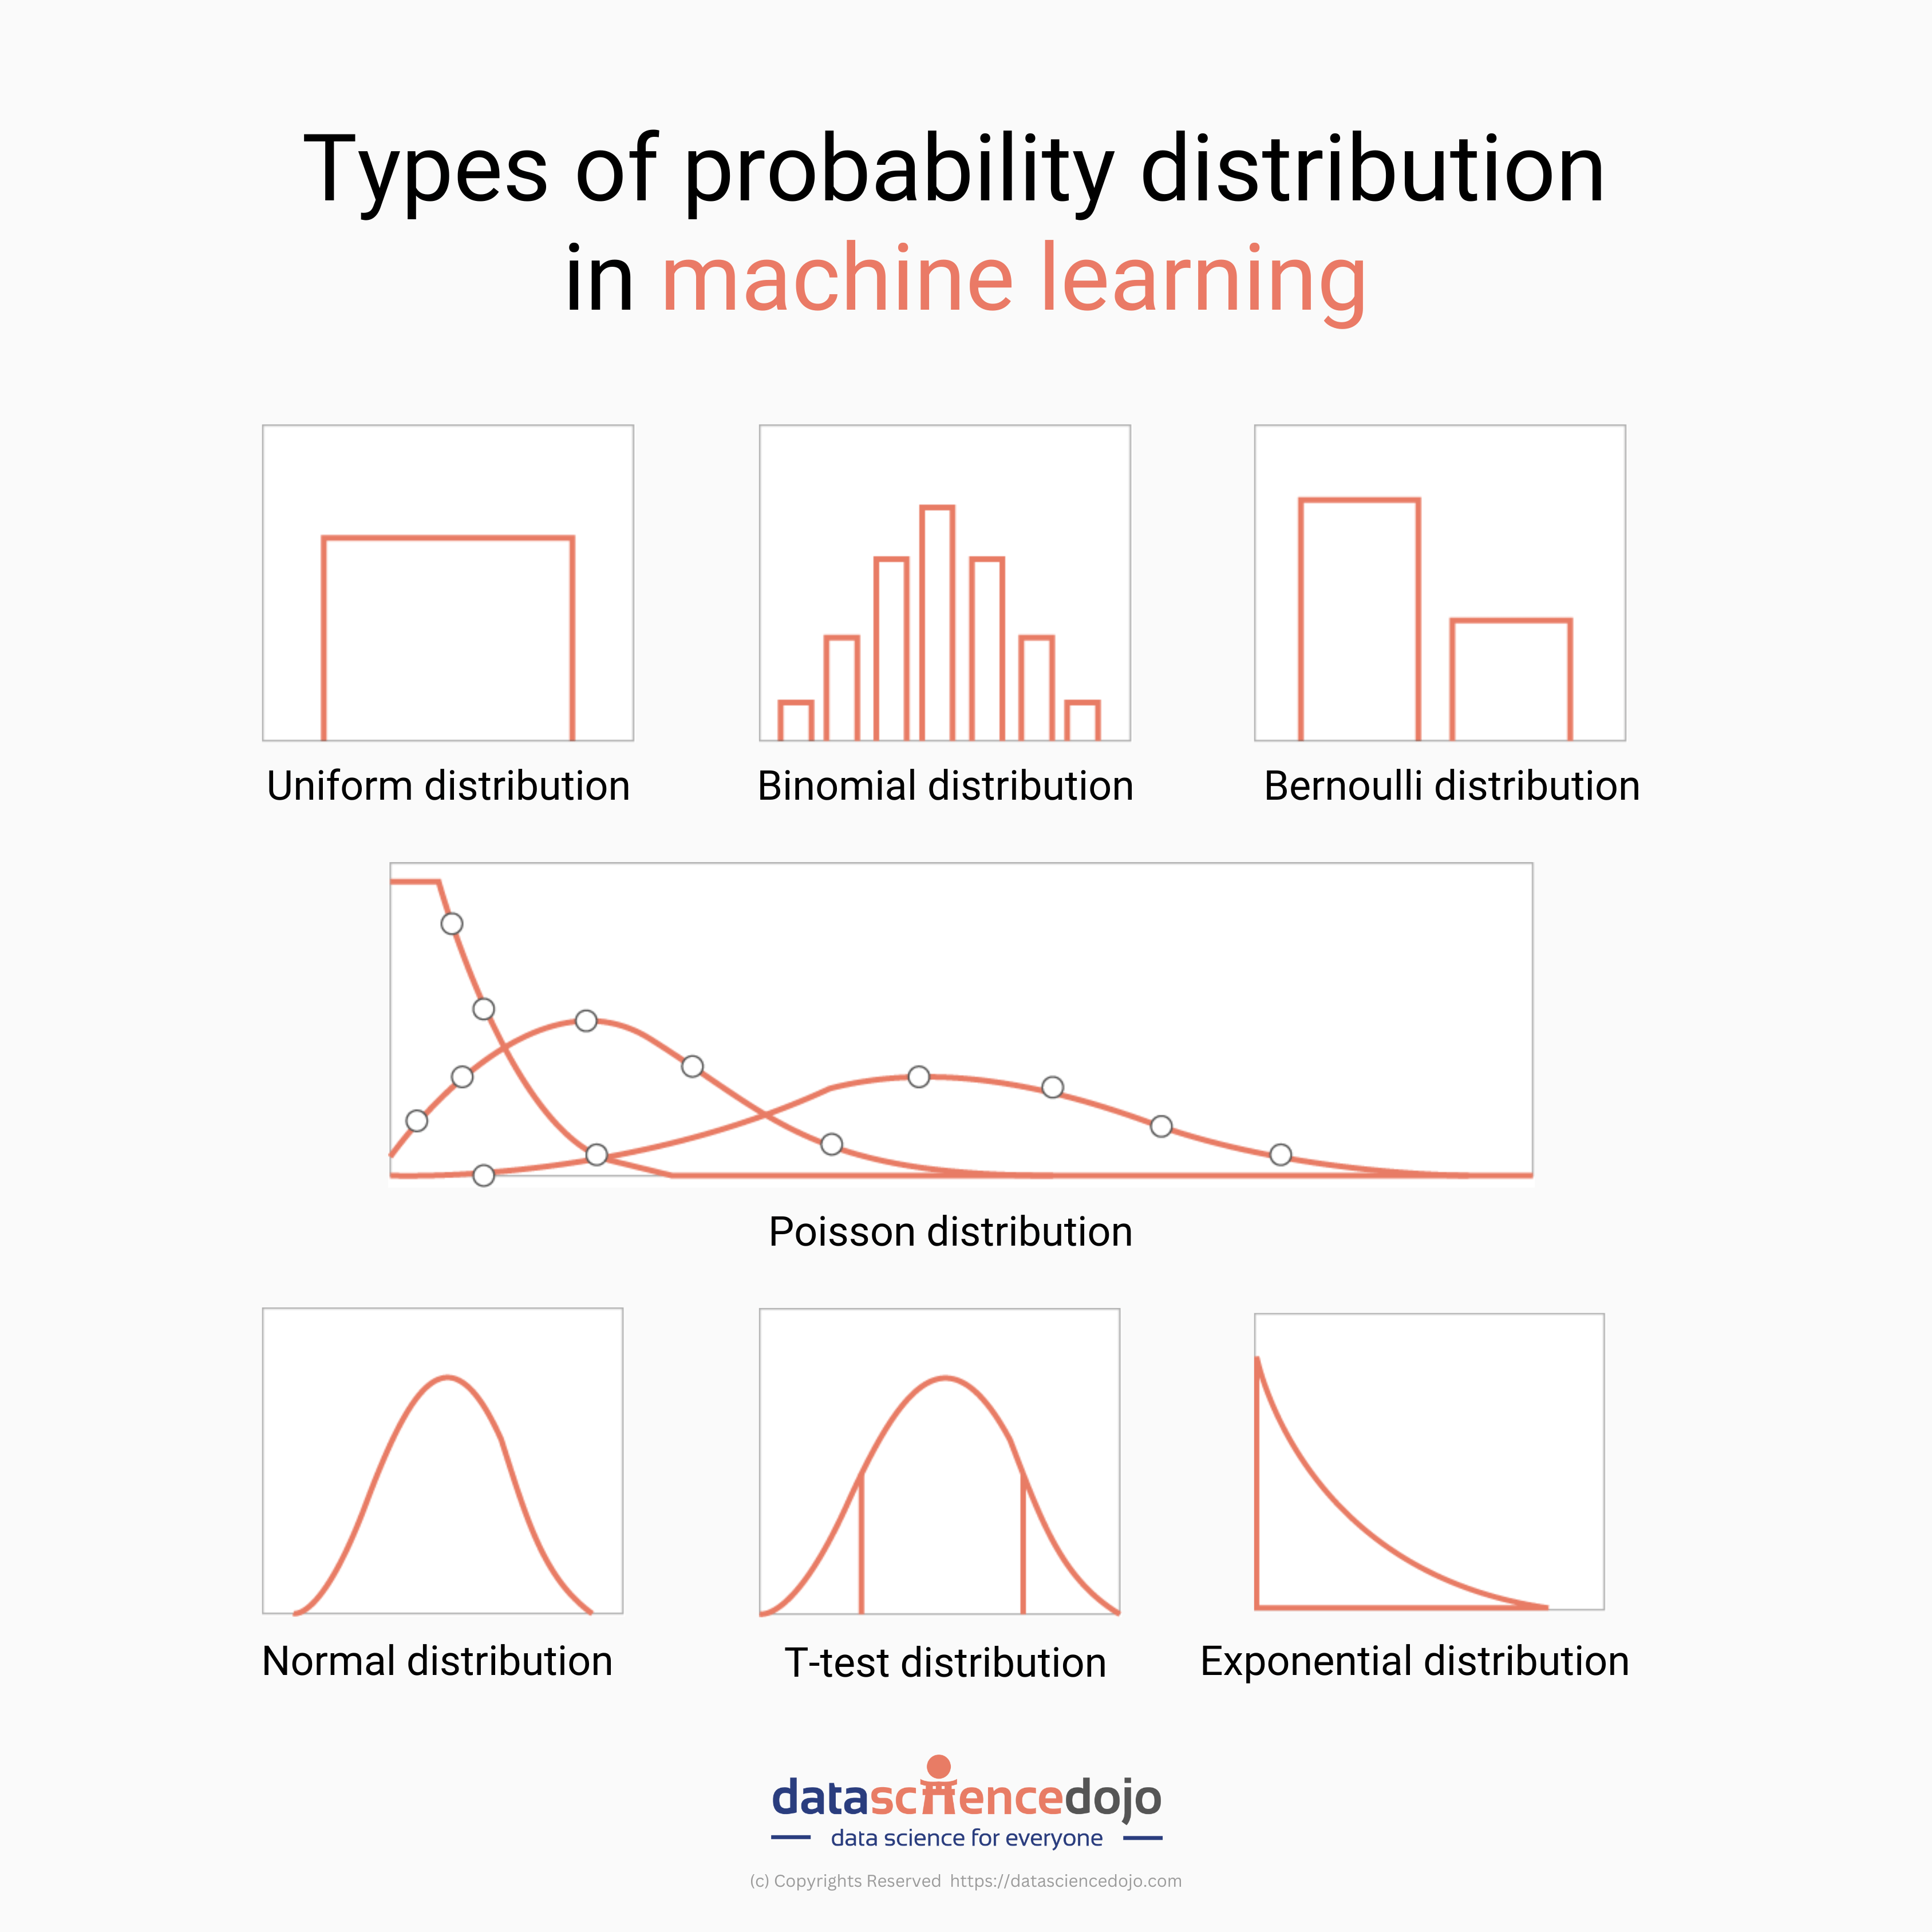
A data distribution describes how data is spread out or clustered around a central value. Several statements can accurately describe its aspects. These include measures of central tendency, dispersion, shape, and the presence of outliers.
Central Tendency
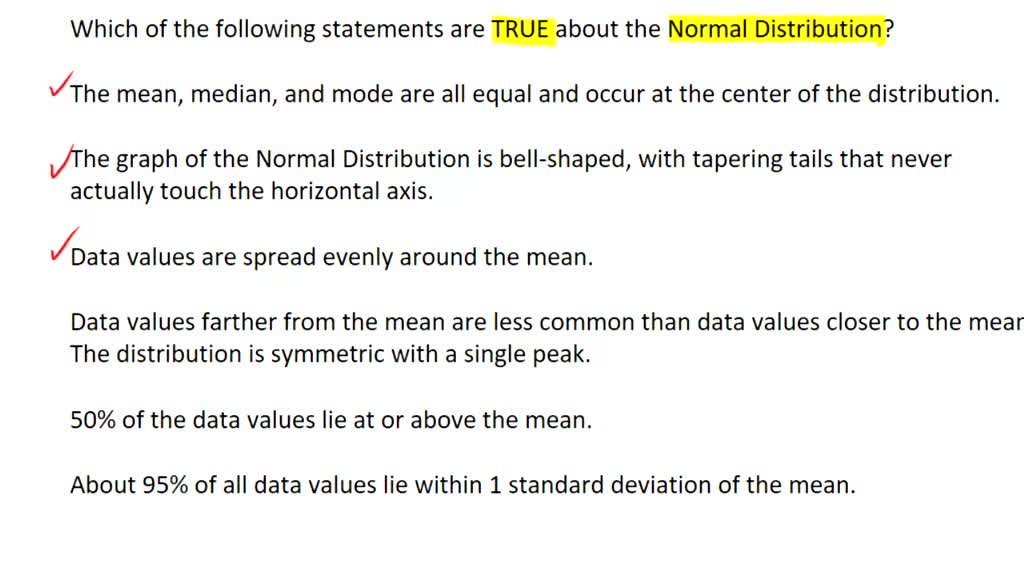
Mean, median, and mode are primary measures of central tendency. The mean is the average value, calculated by summing all values and dividing by the number of values. The median represents the middle value when the data is ordered.
The mode is the most frequently occurring value. A statement describing the mean, median or mode provides information regarding where the data tends to cluster.
Dispersion or Variability
Dispersion measures how spread out the data is. Standard deviation and variance are common measures of dispersion. Standard deviation quantifies the average distance of data points from the mean.
Variance represents the average of the squared differences from the mean. A larger standard deviation or variance indicates greater variability within the data.
Other measures of dispersion include the range, which is the difference between the maximum and minimum values, and interquartile range (IQR), which measures the spread of the middle 50% of the data. Statements about the standard deviation, variance, range or IQR characterize the data's spread.
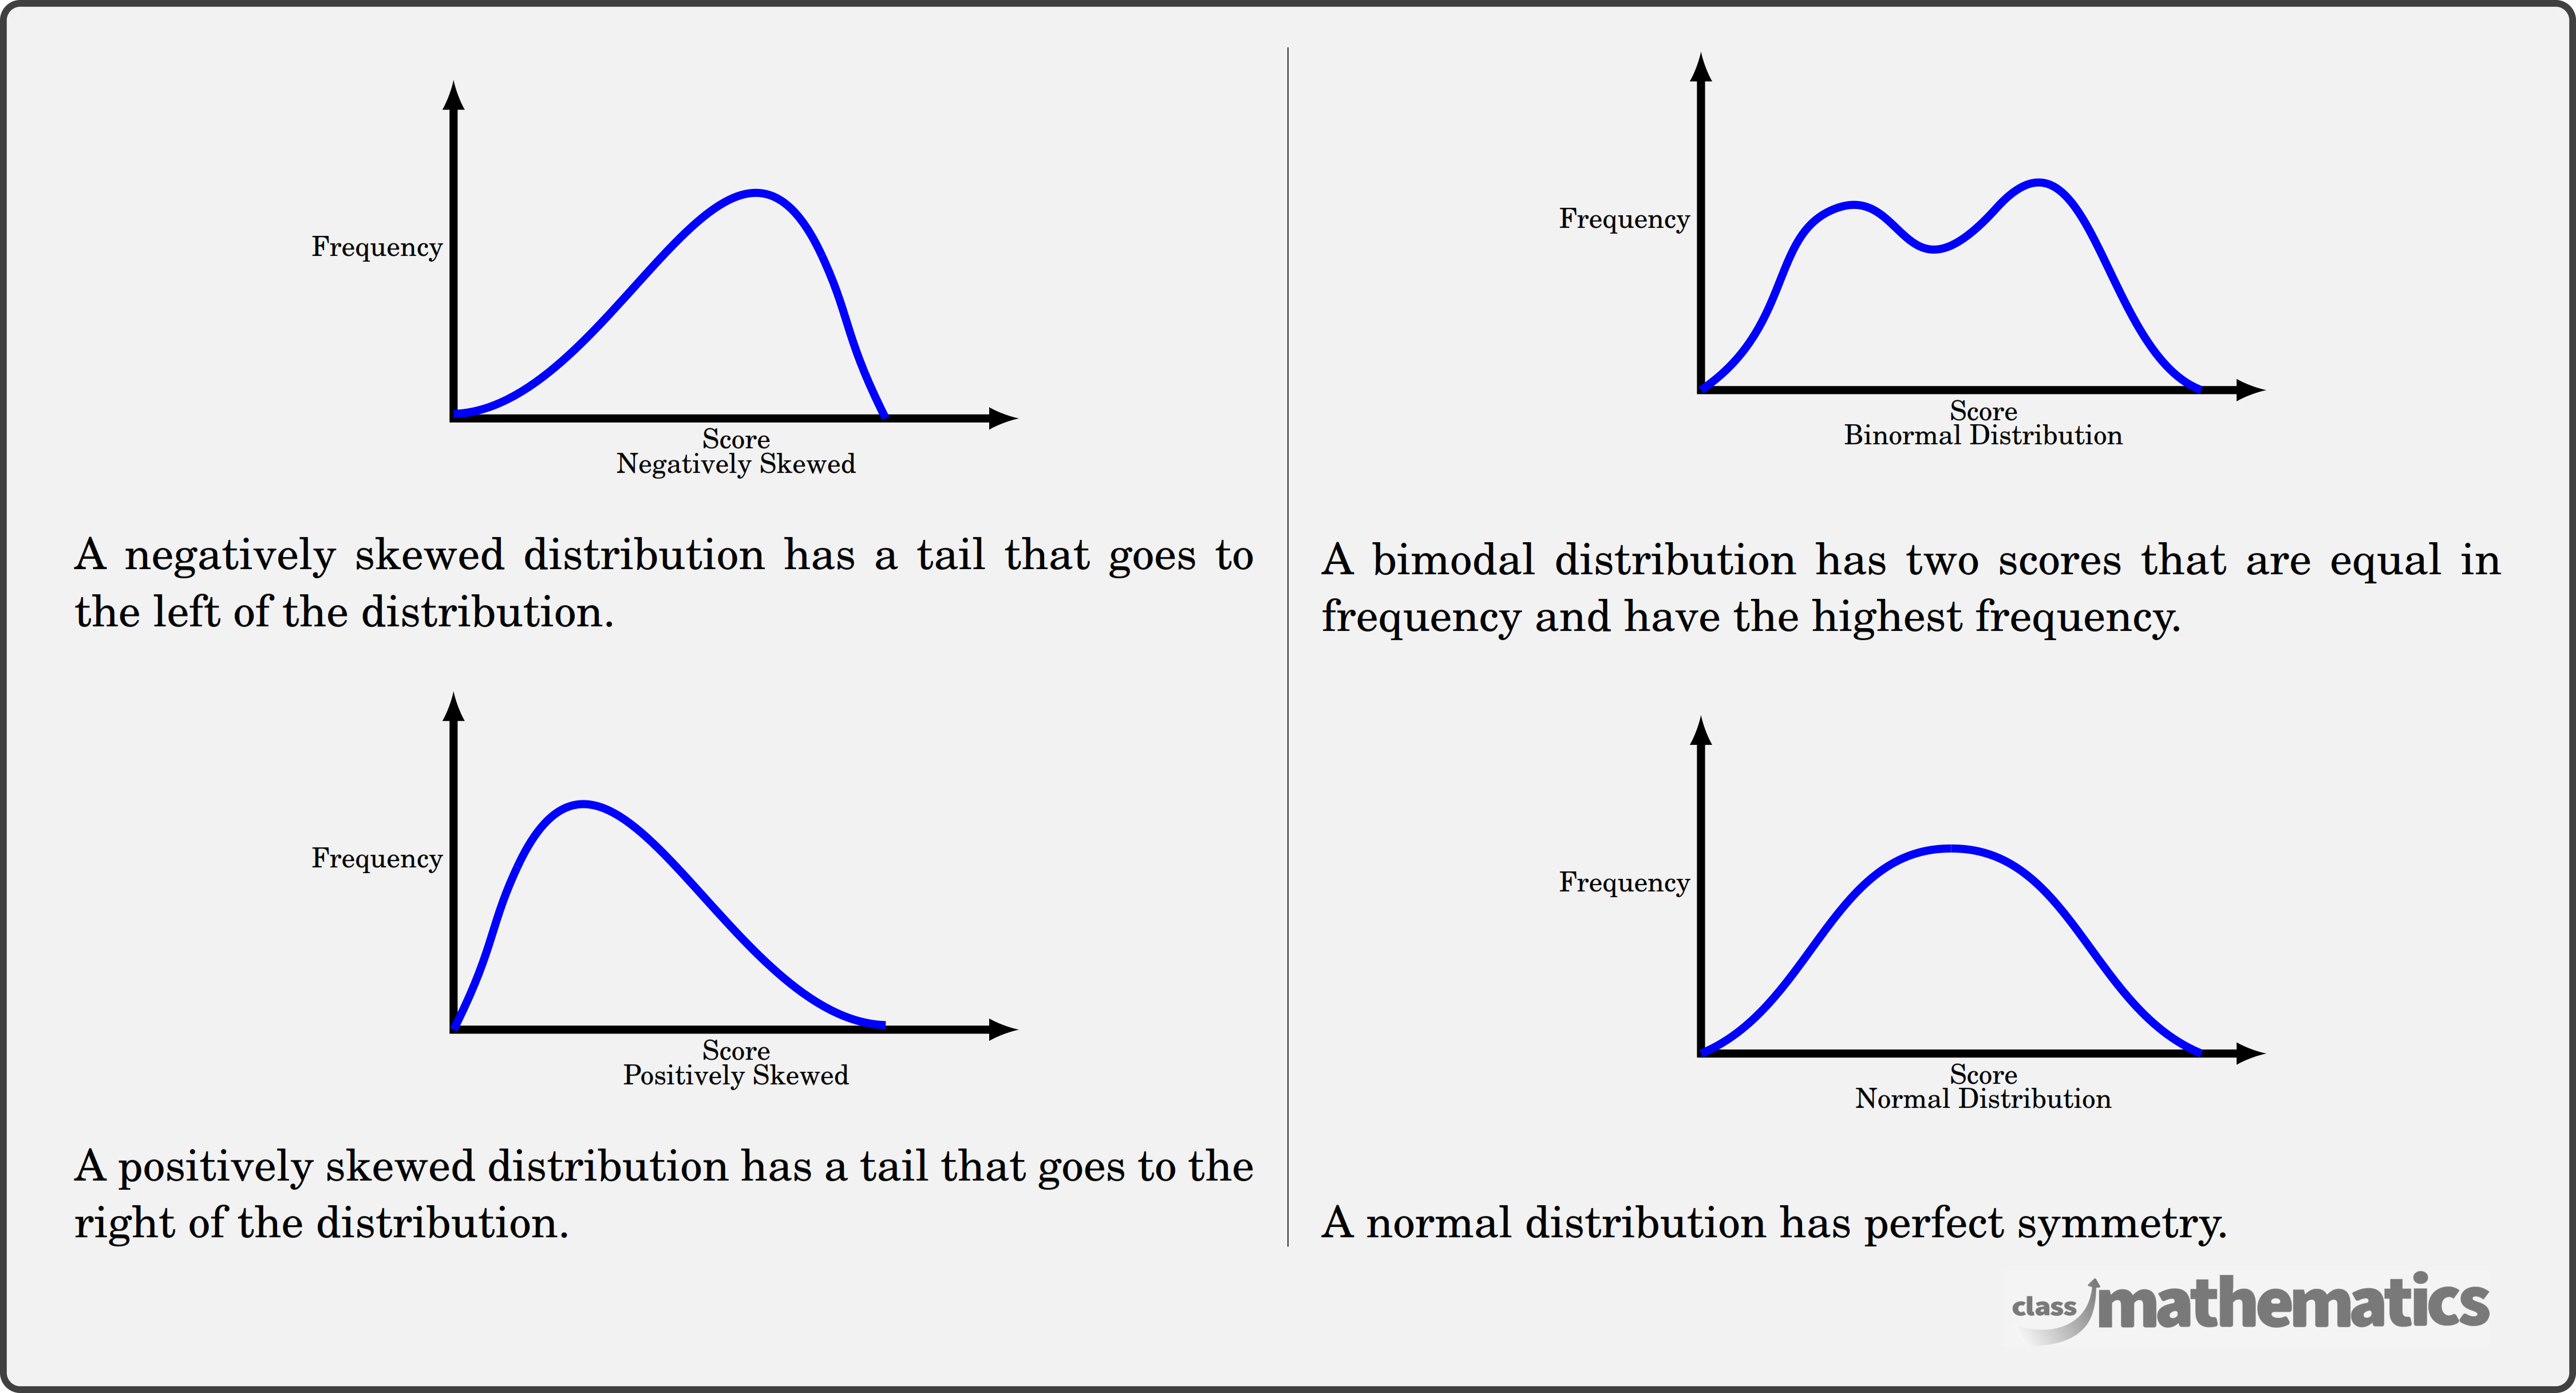
Shape of the Distribution
The shape of a distribution can be described by its skewness and kurtosis. Skewness measures the asymmetry of the distribution.
Kurtosis describes the "tailedness" of the distribution. High kurtosis indicates heavier tails and a sharper peak (leptokurtic), while low kurtosis indicates lighter tails and a flatter peak (platykurtic).
Statements describing the skewness or kurtosis of a distribution provides crucial information about its shape. Symmetry and number of modes are also descriptors of the shape.
Outliers
Outliers are data points that significantly deviate from the other values in the dataset. They can be identified using various methods, such as box plots or by considering values beyond a certain number of standard deviations from the mean.
The presence and description of outliers is an important aspect of the distribution. Ignoring or misinterpreting outliers can severely skew analysis.
Examples of Accurate Statements
Consider a dataset representing the ages of participants in a study. An accurate statement would be: "The distribution of ages is skewed to the right, with a mean of 35 years and a standard deviation of 10 years."
Another example: "The median income for the sample is $60,000, with outliers at both the high and low ends of the income spectrum." These statements combine several descriptive aspects.
Common Misconceptions
Confusing standard deviation with standard error is a common error. Standard error measures the variability of the sample mean, not the variability within the entire dataset. Another error is assuming normality without verifying it.
Distributions are often incorrectly assumed to be normal without proper testing. The presence of outliers is often overlooked, leading to incorrect interpretations of central tendency.
The Road Ahead
Educational initiatives and training programs focused on statistical literacy are crucial. Emphasis should be placed on the correct interpretation of distributional aspects and the avoidance of common errors.
Data analysis tools should incorporate features that facilitate the visualization and accurate description of distributions. Ongoing research and development should focus on enhancing statistical education at all levels.